Suzuki 2014 Annual Report Download - page 31
Download and view the complete annual report
Please find page 31 of the 2014 Suzuki annual report below. You can navigate through the pages in the report by either clicking on the pages listed below, or by using the keyword search tool below to find specific information within the annual report.-
 1
1 -
2
-
3
-
4
-
5
-
6
-
7
-
8
-
9
-
10
-
11
-
12
-
13
-
14
-
15
-
16
-
17
-
18
-
19
-
20
-
 21
21 -
 22
22 -
 23
23 -
 24
24 -
 25
25 -
 26
26 -
 27
27 -
 28
28 -
 29
29 -
 30
30 -
 31
31 -
 32
32 -
 33
33 -
 34
34 -
 35
35 -
 36
36 -
 37
37 -
 38
38 -
 39
39 -
 40
40 -
 41
41 -
42
-
43
-
44
-
45
-
46
-
47
-
48
-
49
-
50
-
51
-
52
-
53
-
54
-
55
-
56
-
57
-
58
-
59
-
60
-
61
-
62
-
63
-
64
-
65
-
66
-
67
-
68
-
69
-
70
 |
 |

Management discussion and analysis
SUZUKI MOTOR CORPORATION 29
Management discussion and analysis
SUZUKI MOTOR CORPORATION 29
1. Operating results
(1) The operating results by segment
(a) Motorcycle
The net sales increased by ¥36.3 billion (15.8%) to ¥266.6 billion year-on-year, mainly owing to the impact of the exchange
rate and launch of new large-displacement motorcycle V-Strom 1000 ABS in Europe. As for the operating income, the operat-
ing loss of ¥11.9 billion in the previous scal year became an operating income of ¥100 million, slightly turning into the black
for the rst time in six scal years, mainly owing to improvement in income of large displacement motorcycles.
(b) Automobile
The Japanese domestic net sales increased year-on-year as a result of expanding its sales and strengthening the products
such as by improvement in fuel efciency of the Alto Eco and launch of new-genre mini passenger car Hustler, in addition
to great sales of the Spacia, as well as the impact of last-minute demand due to increase in consumption tax rate. As for the
overseas, the net sales increased year-on-year mainly owing to increase in Europe, India, and Indonesia. As a result, the
overall net sales of the automobile business increased by ¥317.9 billion (13.8%) to ¥2,615.7 billion year-on-year. The operat-
ing income increased by ¥28.7 billion (19.0%) to ¥179.3 billion year-on-year, mainly owing to improvement in export prot from
Japan by the impact of the exchange rate and increase in income in Asia.
(c) Marine and Power products, etc.
The net sales increased by ¥5.8 billion (11.6%) to ¥56.0 billion year-on-year, mainly owing to increase in sales of outboard mo-
tors in Europe. The operating income increased by ¥2.4 billion (41.5%) to ¥8.3 billion year-on-year.
(2) The operating results by geographical areas
(a) Japan
The net sales increased by ¥149.6 billion (9.6%) to ¥1,701.7 billion year-on-year. The Company was able to increase sales by
covering decrease in OEM sales with increase in sales of Suzuki brand vehicles, impact of the exchange rate and others. The
operating income increased by ¥32.0 billion (31.2%) to ¥134.5 billion year-on-year because of improvement of export prot
owing to the impact of the exchange rate and other causes.
(b) Europe
The net sales increased by ¥118.2 billion (45.8%) to ¥376.5 billion year-on-year owing to launch of C-segment crossover
model SX4 S-CROSS, new large displacement motorcycle and other causes. The operating loss of ¥1.1 billion in the previous
scal year became an operating income of ¥4.2 billion, turning into the black.
(c) Asia
The net sales increased by ¥194.4 billion (19.8%) to ¥1,175.4 billion year-on-year mainly owing to increased sales of automo-
biles in Indonesia and Thailand, impact of exchange rate and other causes. The operating income increased by ¥21.3 billion
(56.1%) to ¥59.4 billion year-on-year.
(d) Other areas
The net sales decreased by ¥18.1 billion (10.7%) to ¥151.0 billion year-on-year owing to winding down of automobile market-
ing business in the United States and other causes. The operating income decreased by ¥2.9 billion (92.1%) to ¥200 million
year-on-year.
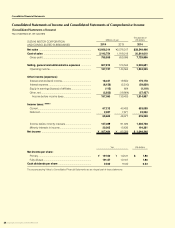
(3) Selling, general and administrative expenses
In the current consolidated scal year, the amount of selling, general and administrative expenses increased by ¥93.3 billion (18.1%)
to ¥607.8 billion year-on-year because of increase of sales expenses such as advertising expenses.
(4) Other income and expenses
In the current consolidated scal year, the net amount of other income and expenses was a gain of ¥9.3 billion, which increased by ¥14.5
billion year-on-year. This was mainly due to decrease of loss on liquidation of subsidiaries and afliates from the previous scal year.