Suzuki 2014 Annual Report Download - page 57
Download and view the complete annual report
Please find page 57 of the 2014 Suzuki annual report below. You can navigate through the pages in the report by either clicking on the pages listed below, or by using the keyword search tool below to find specific information within the annual report.-
 1
1 -
2
-
3
-
4
-
5
-
6
-
7
-
8
-
9
-
10
-
11
-
12
-
13
-
14
-
15
-
16
-
17
-
18
-
19
-
20
-
21
-
22
-
23
-
24
-
25
-
26
-
27
-
28
-
29
-
30
-
31
-
32
-
33
-
34
-
35
-
36
-
37
-
38
-
39
-
40
-
41
-
42
-
43
-
44
-
45
-
46
-
 47
47 -
 48
48 -
 49
49 -
 50
50 -
 51
51 -
 52
52 -
 53
53 -
 54
54 -
 55
55 -
 56
56 -
 57
57 -
 58
58 -
 59
59 -
 60
60 -
 61
61 -
 62
62 -
 63
63 -
 64
64 -
 65
65 -
 66
66 -
 67
67 -
68
-
69
-
70
 |
 |

Consolidated Financial Statements
SUZUKI MOTOR CORPORATION 55
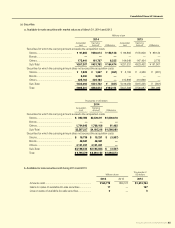
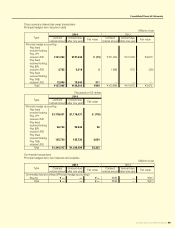
NOTE 8: Income taxes
Breakdown of deferred tax assets and deferred tax liabilities by their main occurrence causes were as follows:
Millions of yen
Thousands of
US dollars
2014 2013 2014
Deferred tax assets
Excess-depreciation and Impairment loss ....................... ¥ 59,105 ¥ 68,083 $ 574,283
Various reserves ................................................................. 39,548 41,433 384,268
Unrealized prots elimination ............................................ 20,876 18,725 202,839
Loss on valuation of securities .......................................... 12,254 12,648 119,071
Deferred assets and others ............................................... 3,367 3,154 32,723
Others ................................................................................. 82,757 76,845 804,095
Gross deferred tax assets total ....................................... 217,910 220,892 2,117,283
Valuation allowance ........................................................... (54,930)(48,183)(533,715)
Deferred tax assets total ................................................. ¥162,980 ¥172,708 $1,583,567
Deferred tax liabilities
Valuation difference on available-for-sale securities ........ ¥(56,219)¥ (30,468)$(546,247)
Variance from the complete market value method of
consolidated subsidiaries ................................................. (5,243)(5,167)(50,948)
Reserve for advanced depreciation of noncurrent assets
... (3,603)(3,555)(35,012)
Others ................................................................................. (2,071)(4,140)(20,131)
Deferred tax liabilities total .............................................. (67,138)(43,332)(652,340)
Net amounts of deferred tax assets .................................. ¥ 95,841 ¥129,376 $ 931,226
The differences between the statutory tax rate and the effective tax rate were summarized as follows:
2014 2013
Statutory tax rate .................................................................... 37.2% 37.2%
Effect of change of tax rate ............................................... 3.1% 2.7%
Tax credit ............................................................................ (3.3%) (5.9%)
Tax rate difference (consolidated overseas subsidiaries) (2.0%) —%
Others ................................................................................. 0.3% 0.7%
Effective tax rate .................................................................... 35.3% 34.7%