Suzuki 2014 Annual Report Download - page 33
Download and view the complete annual report
Please find page 33 of the 2014 Suzuki annual report below. You can navigate through the pages in the report by either clicking on the pages listed below, or by using the keyword search tool below to find specific information within the annual report.-
 1
1 -
2
-
3
-
4
-
5
-
6
-
7
-
8
-
9
-
10
-
11
-
12
-
13
-
14
-
15
-
16
-
17
-
18
-
19
-
20
-
21
-
22
-
 23
23 -
 24
24 -
 25
25 -
 26
26 -
 27
27 -
 28
28 -
 29
29 -
 30
30 -
 31
31 -
 32
32 -
 33
33 -
 34
34 -
 35
35 -
 36
36 -
 37
37 -
 38
38 -
 39
39 -
 40
40 -
 41
41 -
 42
42 -
 43
43 -
44
-
45
-
46
-
47
-
48
-
49
-
50
-
51
-
52
-
53
-
54
-
55
-
56
-
57
-
58
-
59
-
60
-
61
-
62
-
63
-
64
-
65
-
66
-
67
-
68
-
69
-
70
 |
 |

SUZUKI MOTOR CORPORATION 31
SUZUKI MOTOR CORPORATION
CONSOLIDATED
Millions of yen
(except per share amounts)
Thousands of
US dollars
(except per
share amounts)
Years ended March 31 2014 2013 2012 2011 2010 2014
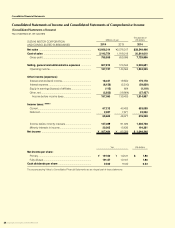
Net sales ...................................... ¥2,938,314 ¥2,578,317 ¥2,512,186 ¥2,608,217 ¥2,469,063 $28,549,496
Net income................................... 107,484 80,389 53,887 45,174 28,913 1,044,346
Net income per share:
Primary ..................................... 191.60 143.31 96.06 80.65 62.76 1.86
Fully diluted ............................ 191.57 131.67 88.28 74.11 55.26 1.86
Cash dividends per share ........... 24.00 18.00 15.00 13.00 12.00 0.23
Net assets .................................... 1,494,357 1,298,553 1,111,757 1,106,999 1,089,757 14,519,602
Total current assets ...................... 1,790,832 1,560,218 1,509,568 1,372,885 1,479,336 17,400,238
Total assets .................................. 2,874,074 2,487,635 2,302,439 2,224,344 2,381,314 27,925,327
Depreciation and amortization .... 117,188 93,680 103,117 138,368 141,846 1,138,639
NON-CONSOLIDATED
Millions of yen
(except per share amounts)
Thousands of
US dollars
(except per
share amounts)
Years ended March 31 2014 2013 2012 2011 2010 2014
Net sales ...................................... ¥1,498,853 ¥1,422,595 ¥1,383,269 ¥1,409,205 ¥1,286,633 $14,563,284
Net income................................... 67,219 36,405 15,846 10,834 7,086 653,119
Net income per share:
Primary ..................................... 119.81 64.89 28.25 19.34 15.38 1.16
Fully diluted ............................ 119.79 59.64 25.98 17.80 13.57 1.16
Cash dividends per share ........... 24.00 18.00 15.00 13.00 12.00 0.23
Net assets .................................... 859,224 761,353 703,292 691,207 673,803 8,348,468
Total current assets ...................... 1,070,668 921,352 921,669 818,964 899,655 10,402,916
Total assets .................................. 1,850,068 1,641,700 1,597,903 1,524,232 1,625,023 17,975,787
Depreciation and amortization .... 33,605 35,626 38,532 61,265 72,359 326,519
Note: Yen amounts are translated into US dollars for convenience only, at ¥102.92 = US$1, the prevailing exchange rate as of March 31, 2014.
Five-Year Summary
SUZUKI MOTOR CORPORATION 31