Suzuki 2014 Annual Report Download - page 63
Download and view the complete annual report
Please find page 63 of the 2014 Suzuki annual report below. You can navigate through the pages in the report by either clicking on the pages listed below, or by using the keyword search tool below to find specific information within the annual report.-
 1
1 -
2
-
3
-
4
-
5
-
6
-
7
-
8
-
9
-
10
-
11
-
12
-
13
-
14
-
15
-
16
-
17
-
18
-
19
-
20
-
21
-
22
-
23
-
24
-
25
-
26
-
27
-
28
-
29
-
30
-
31
-
32
-
33
-
34
-
35
-
36
-
37
-
38
-
39
-
40
-
41
-
42
-
43
-
44
-
45
-
46
-
47
-
48
-
49
-
50
-
51
-
52
-
 53
53 -
 54
54 -
 55
55 -
 56
56 -
 57
57 -
 58
58 -
 59
59 -
 60
60 -
 61
61 -
 62
62 -
 63
63 -
 64
64 -
 65
65 -
 66
66 -
 67
67 -
 68
68 -
 69
69 -
 70
70
 |
 |

Consolidated Financial Statements
SUZUKI MOTOR CORPORATION 61
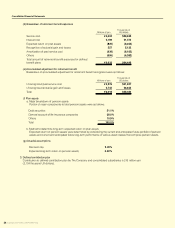
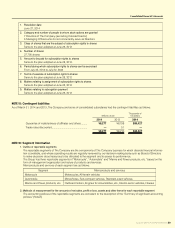
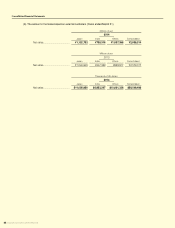
(Reference information)
As reference information, operating results by geographical areas were as follows:
(a) The amount of net sales, operating income or loss based on location of
The Company and its consolidated subsidiaries (Years ended March 31)
Millions of yen
2014
Japan Europe Asia
Other
areas Eliminations Consolidated
Net Sales:
Net sales to external customers ...
¥1,309,383
¥360,465 ¥1,118,169 ¥150,296 ¥ —
¥2,938,314
Internal net sales or transfer
among geographical areas ..........
392,284
16,000 57,185 679 (466,149) —
Total
1,701,667
376,466 1,175,355 150,975 (466,149)
2,938,314
Operating income .............................
134,513 4,154 59,419 241 (10,582
)
187,747
Millions of yen
2013
Japan Europe Asia
Other
areas Eliminations Consolidated
Net Sales:
Net sales to external customers ...
¥1,203,474
¥ 254,692 ¥ 951,713 ¥ 168,437 ¥ —
¥2,578,317
Internal net sales or transfer
among geographical areas ..........
348,576
3,594 29,298 660 (382,129)
—
Total
1,552,050
258,287 981,012 169,097 (382,129)
2,578,317
Operating income (loss) ...................
102,516 (1,062
)
38,071 3,052 1,986 144,564
Thousands of US dollars
2014
Japan Europe Asia
Other
areas Eliminations Consolidated
Net sales:
Net sales to external customers ...
$12,722,338
$3,502,383
$10,864,455
$1,460,318 $ —
$28,549,496
Internal net sales or transfer
among geographical areas ..........
3,811,545
155,467
555,629
6,597 (4,529,239) —
Total
16,533,884
3,657,850
11,420,085
1,466,916 (4,529,239)
28,549,496
Operating income .............................
1,306,974
40,361
577,338
2,350 (102,819)
1,824,205
* “Other areas” consists principally of North America, Oceania and South America.