Suzuki 2014 Annual Report Download - page 39
Download and view the complete annual report
Please find page 39 of the 2014 Suzuki annual report below. You can navigate through the pages in the report by either clicking on the pages listed below, or by using the keyword search tool below to find specific information within the annual report.-
 1
1 -
2
-
3
-
4
-
5
-
6
-
7
-
8
-
9
-
10
-
11
-
12
-
13
-
14
-
15
-
16
-
17
-
18
-
19
-
20
-
21
-
22
-
23
-
24
-
25
-
26
-
27
-
28
-
 29
29 -
 30
30 -
 31
31 -
 32
32 -
 33
33 -
 34
34 -
 35
35 -
 36
36 -
 37
37 -
 38
38 -
 39
39 -
 40
40 -
 41
41 -
 42
42 -
 43
43 -
 44
44 -
 45
45 -
 46
46 -
 47
47 -
 48
48 -
 49
49 -
50
-
51
-
52
-
53
-
54
-
55
-
56
-
57
-
58
-
59
-
60
-
61
-
62
-
63
-
64
-
65
-
66
-
67
-
68
-
69
-
70
 |
 |

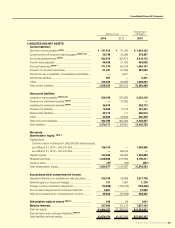
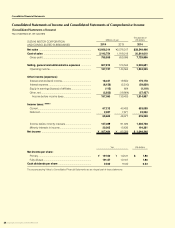
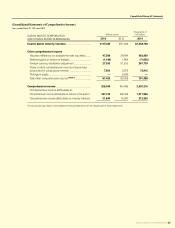
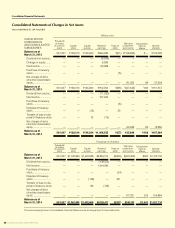
Consolidated Financial Statements
SUZUKI MOTOR CORPORATION 37
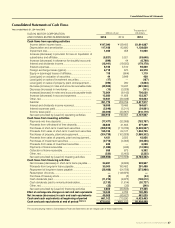
Consolidated Statements of Cash Flows
Years ended March 31, 2014 and 2013
SUZUKI MOTOR CORPORATION
AND CONSOLIDATED SUBSIDIARIES
Millions of yen
Thousands of
US dollars
2014 2013 2014
Cashowsfromoperatingactivities
Income before income taxes ............................................. ¥197,090 ¥139,403 $1,914,987
Depreciation and amortization .......................................... 117,188 93,680 1,138,639
Impairment loss ................................................................. 1,029 458 10,000
Increase (decrease) in provision for loss on liquidation of
subsidiaries and afliates .................................................. (5,521)5,521 (53,648)
Increase (decrease) in allowance for doubtful accounts (699)44 (6,798)
Interest and dividends income .......................................... (18,441)(19,550)(179,178)
Interest expenses .............................................................. 6,158 5,510 59,839
Foreign exchange losses (gains) ...................................... 6,718 670 65,278
Equity in (ear nings) losses of afliates .............................. 115 (664)1,119
Loss (gain) on valuation of securities ............................... 44 3,849 428
Loss (gain) on sales of investment securities ................... (17)—(167)
Loss (gain) on sales of property, plant and equipment ... (290)200 (2,823)
Decrease (increase) in notes and accounts receivable-trade
(49,559)10,247 (481,530)
Decrease (increase) in inventories ................................... (10)(3,029)(101)
Increase (decrease) in notes and accounts payable-trade
72,664 (8,142)706,030
Increase (decrease) in accrued expenses ...................... 12,680 11,608 123,207
Other, net ............................................................................ 12,621 (30,049)122,633
Subtotal 351,772 209,759 3,417,917
Interest and dividends income received .......................... 18,999 19,466 184,601
Interest expenses paid ...................................................... (5,646)(5,211)(54,861)
Income taxes paid ............................................................. (42,209)(33,957)(410,119)
Net cash provided by (used in) operating activities 322,915 190,057 3,137,537
Cashowsfrominvestingactivities
Payments into time deposits ............................................. (77,477)(32,908)(752,797)
Proceeds from withdrawal of time deposits...................... 38,842 41,603 377,409
Purchases of short-term investment securities ................ (209,912)(113,726)(2,039,567)
Proceeds from sales of short-term investment securities
165,156 64,127 1,604,705
Purchases of property, plant and equipment ................... (204,739)(163,929)(1,989,302)
Proceeds from sales of property, plant and equipment ... 4,421 3,505 42,956
Purchases of investment securities .................................. (2,712)(4,002)(26,356)
Proceeds from sales of investment securities .................. 623 —6,059
Payments of loans receivable ........................................... (1,086)(436)(10,556)
Collection of loans receivable ........................................... 555 673 5,392
Other, net ............................................................................ (230)(5,465)(2,235)
Net cash provided by (used in) investing activities (286,559)(210,559)(2,784,292)
Cashowsfromnancingactivities
Net increase (decrease) in short-term loans payable ...... 24,691 (8,603)239,907
Proceeds from long-term loans payable .......................... 30,000 190,482 291,488
Repayment of long-term loans payable ........................... (38,488)(54,708)(373,966)
Redemption of bonds ........................................................ —(149,975)—
Purchase of treasury stock ................................................ (5)(5)(54)
Cash dividends paid ......................................................... (11,219)(8,975)(109,012)
Cash dividends paid to minority shareholders ................. (2,133)(1,814)(20,727)
Other, net ............................................................................ (35)(32)(340)
Net cash provided by (used in) nancing activities 2,809 (33,632)27,295
Effect of exchange rate changes on cash and cash equivalents
10,342 4,706 100,495
Net increase (decrease) in cash and cash equivalents 49,508 (49,427)481,035
Cash and cash equivalents at beginning of period 661,102 710,530 6,423,463
Cash and cash equivalents at end of period *NOTE 10 ¥710,611 ¥661,102 $6,904,498
The accompanying Notes to Consolidated Financial Statements are an integral part of these statements.