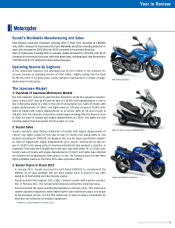
Suzuki 2014 Annual Report Download - page 6
Download and view the complete annual report
Please find page 6 of the 2014 Suzuki annual report below. You can navigate through the pages in the report by either clicking on the pages listed below, or by using the keyword search tool below to find specific information within the annual report.-
 1
1 -
 2
2 -
 3
3 -
 4
4 -
 5
5 -
 6
6 -
 7
7 -
 8
8 -
 9
9 -
 10
10 -
 11
11 -
 12
12 -
 13
13 -
 14
14 -
 15
15 -
 16
16 -
 17
17 -
18
-
19
-
20
-
21
-
22
-
23
-
24
-
25
-
26
-
27
-
28
-
29
-
30
-
31
-
32
-
33
-
34
-
35
-
36
-
37
-
38
-
39
-
40
-
41
-
42
-
43
-
44
-
45
-
46
-
47
-
48
-
49
-
50
-
51
-
52
-
53
-
54
-
55
-
56
-
57
-
58
-
59
-
60
-
61
-
62
-
63
-
64
-
65
-
66
-
67
-
68
-
69
-
70
 |
 |
4 SUZUKI MOTOR CORPORATION
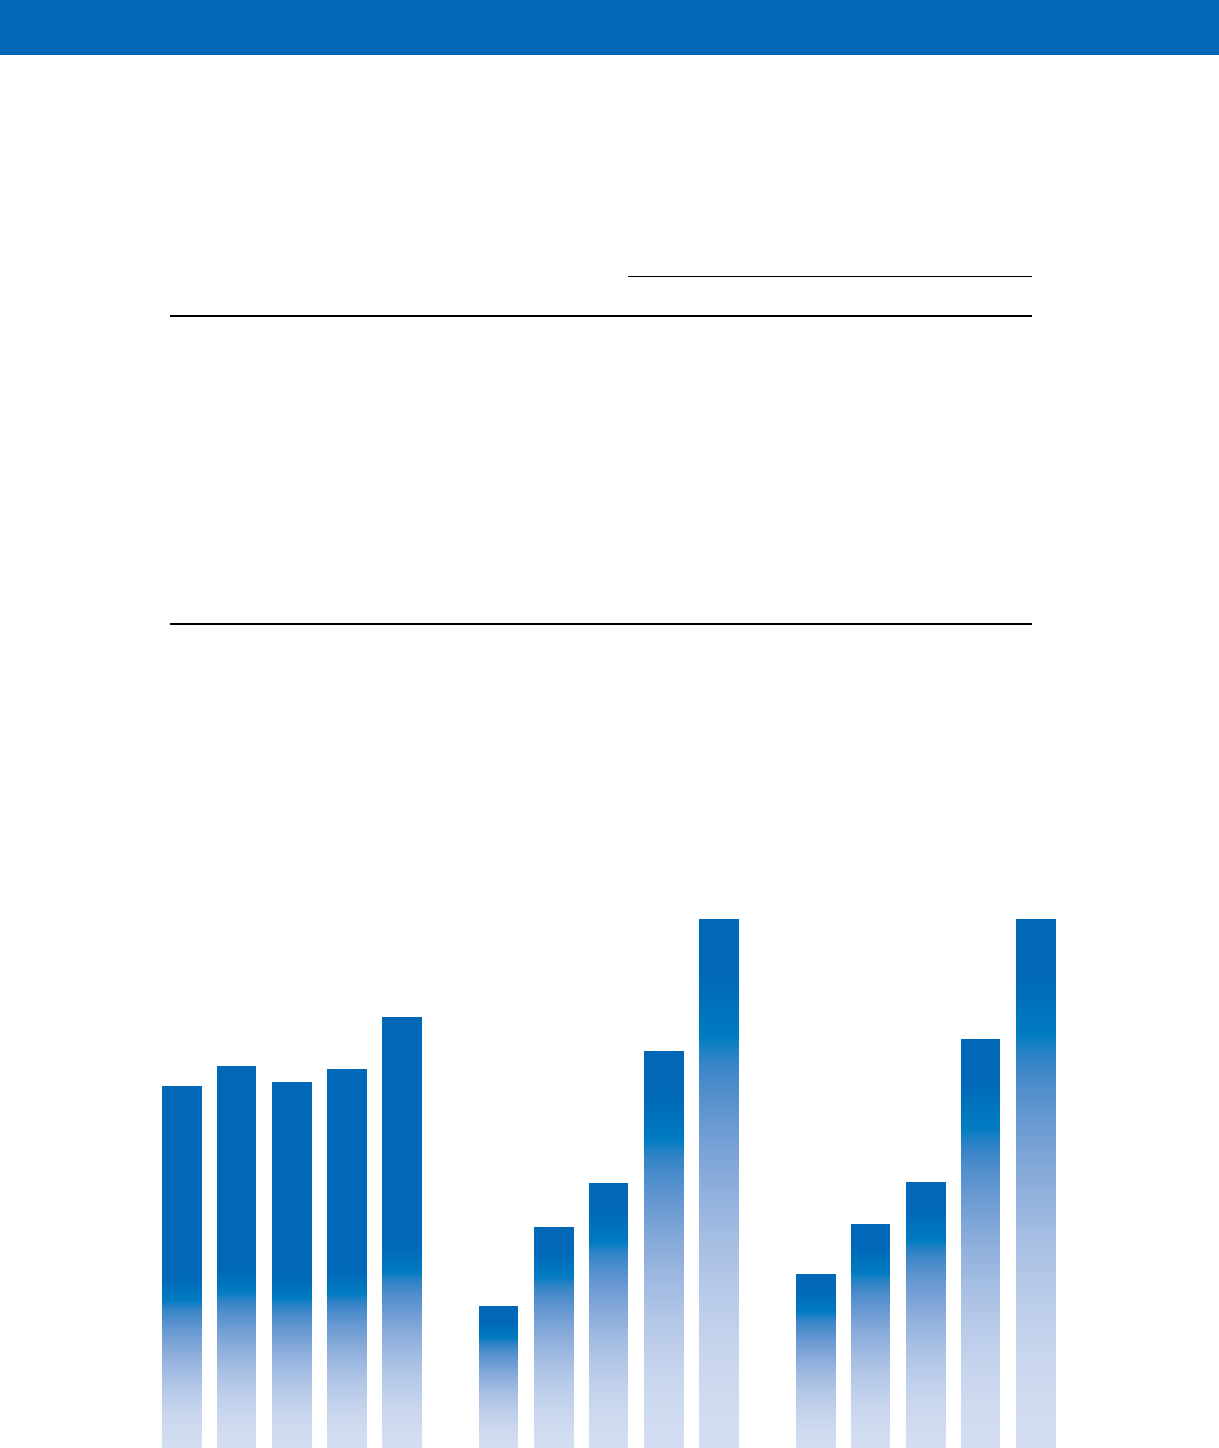
Financial Highlights
Financial Highlights
SUZUKI MOTOR CORPORATION
AND CONSOLIDATED SUBSIDIARIES
Years ended March 31, 2014 and 2013
Millions of yen
(except per share amounts)
Thousands of US
dollars (except per
share amounts)
2014 2013 2014
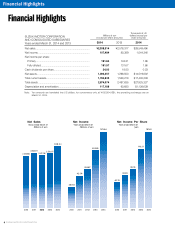
Net sales ................................................................................ ¥2,938,314 ¥2,578,317 $28,549,496
Net income............................................................................. 107,484 80,389 1,044,346
Net income per share:
Primary ............................................................................... 191.60 143.31 1.86
Fully diluted ........................................................................ 191.57 131.67 1.86
Cash dividends per share ..................................................... 24.00 18.00 0.23
Net assets .............................................................................. 1,494,357 1,298,553 $14,519,602
Total current assets ................................................................ 1,790,832 1,560,218 $17,400,238
Total assets ............................................................................ 2,874,074 2,487,635 $27,925,327
Depreciation and amortization .............................................. 117,188 93,680 $1,138,639
Note: Yen amounts are translated into US dollars, for convenience only, at ¥102.92=US$1, the prevailing exchange rate on
March 31, 2014.
2,469,063
2,608,217
28,913
45,174
62.76
80.65
2,512,186
53,887 96.06
Years ended March 31
(Millions of yen)
Net Sales
Years ended March 31
(Millions of yen)
Net Income
Years ended March 31
(yen)
Net Income Per Share
2010 2010 2 011 2012 2010 2 011 20122011 2012
2,578,317
2012 2013
80,389
2013
143.31
2013
2,938,314
2014
107,484
2014
191.60
2014