Suzuki 2014 Annual Report Download - page 47
Download and view the complete annual report
Please find page 47 of the 2014 Suzuki annual report below. You can navigate through the pages in the report by either clicking on the pages listed below, or by using the keyword search tool below to find specific information within the annual report.-
 1
1 -
2
-
3
-
4
-
5
-
6
-
7
-
8
-
9
-
10
-
11
-
12
-
13
-
14
-
15
-
16
-
17
-
18
-
19
-
20
-
21
-
22
-
23
-
24
-
25
-
26
-
27
-
28
-
29
-
30
-
31
-
32
-
33
-
34
-
35
-
36
-
 37
37 -
 38
38 -
 39
39 -
 40
40 -
 41
41 -
 42
42 -
 43
43 -
 44
44 -
 45
45 -
 46
46 -
 47
47 -
 48
48 -
 49
49 -
 50
50 -
 51
51 -
 52
52 -
 53
53 -
 54
54 -
 55
55 -
 56
56 -
 57
57 -
58
-
59
-
60
-
61
-
62
-
63
-
64
-
65
-
66
-
67
-
68
-
69
-
70
 |
 |

Consolidated Financial Statements
SUZUKI MOTOR CORPORATION 45
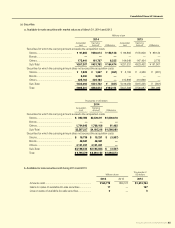
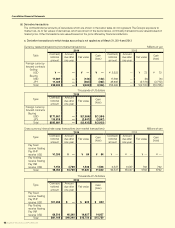
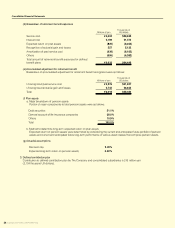
(c) Securities
a. Available-for-sale securities with market value as of March 31, 2014 and 2013
Millions of yen
2014 2013
Acquisition
cost
Carrying
Amount Difference
Acquisition
cost
Carrying
Amount Difference
Securities for which the carrying amount exceeds the acquisition costs
Stocks .................................................... ¥ 91,865 ¥250,014 ¥ 158,148 ¥ 86,883 ¥176,008 ¥ 89,124
Bonds .................................................... ——————
Others .................................................... 175,441 181,767 6,325 144,648 147,424 2,776
Sub-Total ¥267,307 ¥431,782 ¥ 164,474 ¥231,531 ¥323,432 ¥ 91,901
Securities for which the carrying amount does not exceed the acquisition costs
Stocks .................................................... ¥ 1,928 ¥ 1,567 ¥ (361)¥ 5,158 ¥ 4,356 ¥ (801)
Bonds .................................................... 5,000 5,000 ————
Others .................................................... 425,164 425,164 —410,898 410,898 —
Sub-Total ¥432,093 ¥431,732 ¥ (361)¥416,056 ¥415,255 ¥ (801)
Total ¥699,401 ¥863,514 ¥164,113 ¥647,588 ¥738,687 ¥91,099
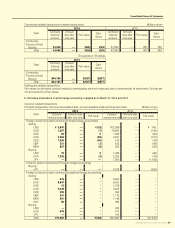
Thousands of US dollars
2014
Acquisition
cost
Carrying
Amount Difference
Securities for which the carrying amount exceeds the acquisition costs
Stocks ....................................................
$ 892,593
$2,429,211
$1,536,618
Bonds .................................................... — — —
Others .................................................... 1,704,643 1,766,106 61,462
Sub-Total
$2,597,237 $4,195,318
$1,598,080
Securities for which the carrying amount does not exceed the acquisition costs
Stocks .................................................... $ 18,739 $ 15,231 $ (3,507)
Bonds .................................................... 48,581 48,581 —
Others .................................................... 4,131,021 4,131,021 —
Sub-Total $4,198,342 $4,194,834 $ (3,507)
Total
$ 6,795,579 $ 8,390,152
$1,594,573
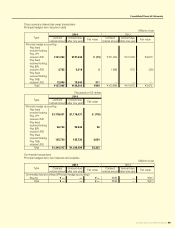
b. Available-for-sale securities sold during 2014 and 2013
Millions of yen
Thousands of
US dollars
2014 2013 2014
Amounts sold ..................................................................... ¥165,779 ¥64,127 $1,610,764
Gains on sales of available-for-sale securities ................. 17 —167
Loss on sales of available-for-sale securities .................. 0—0