Square Enix 2013 Annual Report Download - page 63
Download and view the complete annual report
Please find page 63 of the 2013 Square Enix annual report below. You can navigate through the pages in the report by either clicking on the pages listed below, or by using the keyword search tool below to find specific information within the annual report.-
 1
1 -
2
-
3
-
4
-
5
-
6
-
7
-
8
-
9
-
10
-
11
-
12
-
13
-
14
-
15
-
16
-
17
-
18
-
19
-
20
-
21
-
22
-
23
-
24
-
25
-
26
-
27
-
28
-
29
-
30
-
31
-
32
-
33
-
34
-
35
-
36
-
37
-
38
-
39
-
40
-
41
-
42
-
43
-
44
-
45
-
46
-
47
-
48
-
49
-
50
-
51
-
52
-
 53
53 -
 54
54 -
 55
55 -
 56
56 -
 57
57 -
 58
58 -
 59
59 -
 60
60 -
 61
61 -
 62
62 -
 63
63 -
 64
64 -
 65
65 -
 66
66 -
 67
67 -
 68
68 -
 69
69 -
 70
70
 |
 |

61
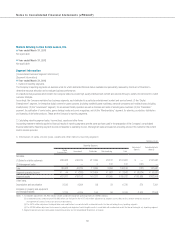
■ Year ended March 31, 2012
1. Outline of reporting segments
The Company’s reporting segments are business units for which abstracted financial data is available and periodically reviewed by the Board of Directors to
determine resource allocation and to evaluate business performance.
In a rapidly evolving business environment, the Company seeks to provide high-quality entertainment content and services through a variety of environment to match
customer lifestyles.
Accordingly, the Company maintains four business segments, each dedicated to a particular entertainment content and service format: (1) the “Digital
Entertainment” segment, for interactive digital content for game consoles (including handheld game machines), personal computers and mobile phones (including
smartphones); (2) the “Amusement” segment, for amusement facility operation as well as the sale and rental of arcade game machines; (3) the “Publication”
segment, for publication of comic books, game strategy books and comic magazines; and (4) the “Merchandising” segment, for planning, production, distribution
and licensing of derivative products. These are the Company’s reporting segments.
2. Calculating reporting segment sales, income (loss), assets and other items
Accounting treatment methods applied to financial results of reporting segments are the same as those used in the preparation of the Company’s consolidated
financial statements. Reporting segment income corresponds to operating income. Intersegment sales are based on prevailing prices in the market for the content
and/or services provided.
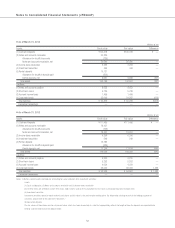
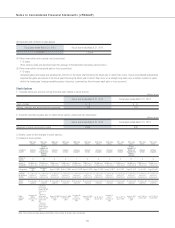
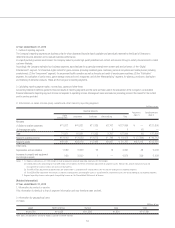
3. Information on sales, income (loss), assets and other items by reporting segment
Millions of yen
Reporting Segments Adjustment
(Note 1)
Consolidated total
(Note 2)
Digital
Entertainment Amusement Publication Merchandising Total
Net sales
(1) Sales to outside customers ¥71,871 ¥41,921 ¥11,335 ¥2,767 ¥127,896 ¥ — ¥127,896
(2) Intersegment sales — — — 0 0 (0) —
Total 71,871 41,921 11,335 2,767 127,896 (0) 127,896
Segment operating income ¥12,602 ¥ 2,552 ¥ 2,575 ¥ 742 ¥ 18,472 ¥ (7,759) ¥ 10,713
Segment assets ¥49,401 ¥23,916 ¥ 5,492 ¥2,957 ¥ 81,767 ¥132,213 ¥213,981
Other items
Depreciation and amortization 1,589 3,363 22 16 4,991 48 5,039
Increases in property and equipment
and intangible assets 936 3,932 1 — 4,870 339 5,209
Notes: 1. (1) Segment adjustments (¥7,759 million) include unallocated corporate operating expenses (¥7,784 million).
(2) Unallocated assets amounting to ¥132,329 million are included in the ¥132,213 million adjustment to segment assets. Most of this amount comprises funds for
management of surplus funds (cash and cash equivalents).
(3) The ¥48 million adjustment to depreciation and amortization is associated with unallocated assets that do not belong to any reporting segment.
(4) The ¥339 million adjustment to increases in property and equipment and intangible assets is associated with unallocated assets that do not belong to any reporting segment.
2. Segment operating income corresponds to operating income on the Consolidated Statements of Income.
[Related Information]
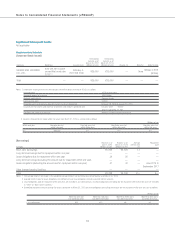
■ Year ended March 31, 2013
1. Information by product or service
This information is identical to that of segment information and has therefore been omitted.
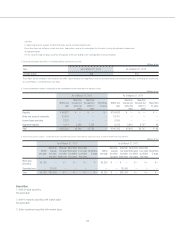
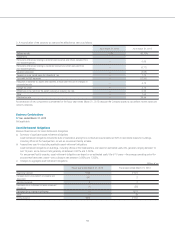
2. Information by geographical area
(1) Sales
Millions of yen
Japan North America Europe Asia Total
¥109,524 ¥14,936 ¥21,588 ¥1,931 ¥147,981
Note: Sales are grouped by country or region, based on customer location.