Square Enix 2013 Annual Report Download - page 12
Download and view the complete annual report
Please find page 12 of the 2013 Square Enix annual report below. You can navigate through the pages in the report by either clicking on the pages listed below, or by using the keyword search tool below to find specific information within the annual report.-
 1
1 -
 2
2 -
 3
3 -
 4
4 -
 5
5 -
 6
6 -
 7
7 -
 8
8 -
 9
9 -
 10
10 -
 11
11 -
 12
12 -
 13
13 -
 14
14 -
 15
15 -
 16
16 -
 17
17 -
 18
18 -
 19
19 -
 20
20 -
 21
21 -
 22
22 -
23
-
24
-
25
-
26
-
27
-
28
-
29
-
30
-
31
-
32
-
33
-
34
-
35
-
36
-
37
-
38
-
39
-
40
-
41
-
42
-
43
-
44
-
45
-
46
-
47
-
48
-
49
-
50
-
51
-
52
-
53
-
54
-
55
-
56
-
57
-
58
-
59
-
60
-
61
-
62
-
63
-
64
-
65
-
66
-
67
-
68
-
69
-
70
 |
 |

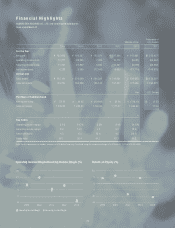
The Square Enix Group (the “Group”) is continuing determined efforts to strengthen the competitiveness and
profitability of its business segments of Digital Entertainment, Amusement, Publication, and Merchandising.
Net sales for the fiscal year ended March 31, 2013 totaled ¥147,981 million (an increase of 15.7% from
the prior fiscal year), operating loss amounted to ¥6,081 million (operating income of ¥10,713 million in the
prior fiscal year), and recurring loss amounted to ¥4,378 million (recurring income of ¥10,297 million in the
prior fiscal year).
In response to the latest environmental changes in the game industry, the Group has implemented
various strategic initiatives such as a change in its development policy, organizational reforms, and the
redesign of some business models. As a result of such initiatives, the Group posted extraordinary losses,
which led to a net loss of ¥13,714 million (net income of ¥6,060 million in the prior fiscal year).
Review of Operations
Digital Entertainment
2011 2012 2013
(Billions of yen)
100
80
60
40
20
0
20
16
12
8
4
0
64.2
17.6% 17.5%
0.0%
71.9
89.5
Net Sales Operating Income Margin
(Years ended March 31)
Publication
2011 2012 2013
(Billions of yen)
15
12
9
6
3
0
30
24
18
12
6
0
24.6%
22.7% 22.4%
Net Sales Operating Income Margin
13.0 11.3 11.1
(Years ended March 31)
2011 2012 2013
(Billions of yen)
60
48
36
24
12
0
8.0
6.0
4.0
2.0
0
-2.0
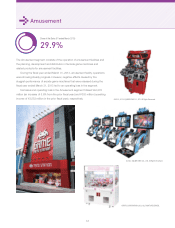
45.0
4.8%
6.1%
-0.8%
41.9 44.3
Net Sales Operating Income Margin
Amusement (Years ended March 31)
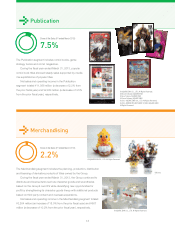
Merchandising
2011 2012 2013
(Billions of yen)
6.0
4.8
3.6
2.4
1.2
0
30
24
18
12
6
0
22.6%
26.8%
20.4%
Net Sales Operating Income Margin
3.0 2.8
3.3
(Years ended March 31)
10