Square Enix 2013 Annual Report Download - page 30
Download and view the complete annual report
Please find page 30 of the 2013 Square Enix annual report below. You can navigate through the pages in the report by either clicking on the pages listed below, or by using the keyword search tool below to find specific information within the annual report.-
 1
1 -
2
-
3
-
4
-
5
-
6
-
7
-
8
-
9
-
10
-
11
-
12
-
13
-
14
-
15
-
16
-
17
-
18
-
19
-
 20
20 -
 21
21 -
 22
22 -
 23
23 -
 24
24 -
 25
25 -
 26
26 -
 27
27 -
 28
28 -
 29
29 -
 30
30 -
 31
31 -
 32
32 -
 33
33 -
 34
34 -
 35
35 -
 36
36 -
 37
37 -
 38
38 -
 39
39 -
 40
40 -
41
-
42
-
43
-
44
-
45
-
46
-
47
-
48
-
49
-
50
-
51
-
52
-
53
-
54
-
55
-
56
-
57
-
58
-
59
-
60
-
61
-
62
-
63
-
64
-
65
-
66
-
67
-
68
-
69
-
70
 |
 |

28
2. Analysis of Financial Policy, Capital Resources and
Liquidity
The Group meets its working capital and capital investment
requirements principally through internal funding resources and the
issuance of corporate bonds. As of March 31, 2013, the Group’s
balance of interest-bearing debt was ¥5,796 million. The net assets
ratio stood at 59.3%. Cash and cash equivalents at the end of the
year totaled ¥98,822 million, a decrease of ¥11,293 million
compared with the previous fiscal year-end.
Cash flows in the fiscal year ended March 31, 2013, as well as the
principal factors behind these cash flows, are described below.
(1) Net Cash Provided by Operating Activities
Net cash provided by operating activities totaled ¥110 million, a
decrease of 98.4% compared with the previous fiscal year.
This position is primarily due to a loss before income taxes and
minority interests of ¥14,948 million, an increase of ¥9,903 million
in notes and accounts receivable, a decrease of ¥10,933 million in
inventories, and ¥7,301 million in depreciation and amortization.
(2) Net Cash Used in Investing Activities
Net cash used in investing activities totaled ¥9,189 million, an
increase of 59.0% compared with the previous fiscal year. The main
factors are proceeds from collection of guarantee deposits of
¥2,928 million, purchase of property and equipment of ¥10,626
million, and purchase of intangible assets of ¥1,392 million.
(3) Net Cash Used in Financing Activities
Net cash used in financing activities totaled ¥3,481 million,
compared with net cash provided by financing activities of ¥299
million in the previous fiscal year. The primary application of funds
was for cash dividends paid of ¥3,444 million.
The Group believes that it will be possible to procure the funds
required for working capital and capital investments in the future to
maintain growth based on its sound financial standing and ability to
generate cash through operating activities.
3. Analysis of Business Performance in the Fiscal Year
Ended March 31, 2013
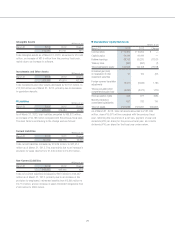
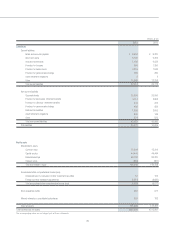
■ Assets
Total Assets Millions of yen
March 31 2013 2012 Change
¥202,509 ¥213,981 ¥(11,472)
Total assets as of March 31, 2013, amounted to ¥202,509 million,
a decrease of ¥11,472 million compared with the previous fiscal
year. The main factors contributing to the change were as follows:
Cash and Deposits
Millions of yen
March 31 2013 2012 Change
¥100,418 ¥111,495 ¥(11,077)
Notes and Accounts Receivable Millions of yen
March 31 2013 2012 Change
¥30,226 ¥18,431 ¥11,795
The year-end balance of notes and accounts receivable varies
greatly depending on the timing of new game title releases. In the
fiscal year ended March 31, 2013, notes and accounts receivable
increased by ¥11,795 million to ¥30,226 million, mainly due to the
March release of “Tomb Raider” in Europe and North America.
Content Production Account Millions of yen
March 31 2013 2012 Change
¥15,805 ¥25,047 ¥(9,242)
As a rule, content development costs incurred during the period
from a title’s formal development authorization through to its
release are capitalized in the content production account. When the
title is released, this amount is then recorded as an expense.
As of March 31, 2013, the content production account totaled
¥15,805 million, a decrease of ¥9,242 million compared with the
previous fiscal year.
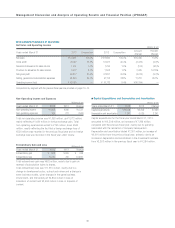
Property and Equipment Millions of yen
March 31 2013 2012 Change
¥20,169 ¥17,183 ¥2,986
Total property and equipment totaled ¥20,169 million, up ¥2,986 million
from the previous fiscal year, primarily due to an increase in buildings
and structures (net) from ¥4,231 million to ¥6,256 million and an
increase in tools and fixtures (net) from ¥1,902 million to ¥3,672 million.
Management Discussion and Analysis of Operating Results and Financial Position (JPNGAAP)