Square Enix 2013 Annual Report Download - page 31
Download and view the complete annual report
Please find page 31 of the 2013 Square Enix annual report below. You can navigate through the pages in the report by either clicking on the pages listed below, or by using the keyword search tool below to find specific information within the annual report.-
 1
1 -
2
-
3
-
4
-
5
-
6
-
7
-
8
-
9
-
10
-
11
-
12
-
13
-
14
-
15
-
16
-
17
-
18
-
19
-
20
-
 21
21 -
 22
22 -
 23
23 -
 24
24 -
 25
25 -
 26
26 -
 27
27 -
 28
28 -
 29
29 -
 30
30 -
 31
31 -
 32
32 -
 33
33 -
 34
34 -
 35
35 -
 36
36 -
 37
37 -
 38
38 -
 39
39 -
 40
40 -
 41
41 -
42
-
43
-
44
-
45
-
46
-
47
-
48
-
49
-
50
-
51
-
52
-
53
-
54
-
55
-
56
-
57
-
58
-
59
-
60
-
61
-
62
-
63
-
64
-
65
-
66
-
67
-
68
-
69
-
70
 |
 |

29
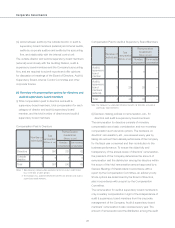
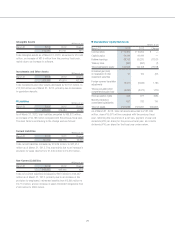
Intangible Assets Millions of yen
March 31 2013 2012 Change
¥10,940 ¥10,121 ¥819
Total intangible assets as of March 31, 2013, amounted to ¥10,940
million, an increase of ¥819 million from the previous fiscal year,
mainly due to an increase in software.
Investments and Other Assets Millions of yen
March 31 2013 2012 Change
¥12,363 ¥14,514 ¥(2,151)
Total investments and other assets decreased by ¥2,151 million, to
¥12,363 million as of March 31, 2013, primarily due to decreases
in guarantee deposits.
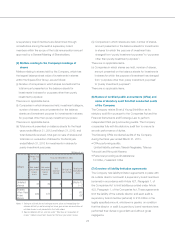
■ Liabilities Millions of yen
March 31 2013 2012 Change
¥80,872 ¥76,684 ¥4,188
As of March 31, 2013, total liabilities amounted to ¥80,872 million,
an increase of ¥4,188 million compared with the previous fiscal year.
The main factors contributing to the change were as follows:
Current Liabilities Millions of yen
March 31 2013 2012 Change
¥37,414 ¥33,778 ¥3,636
Total current liabilities increased by ¥3,636 million, to ¥37,414
million as of March 31, 2013. This was mainly due to an increase in
provision for sales returns from ¥1,545 million to ¥4,319 million.
Non-Current Liabilities Millions of yen
March 31 2013 2012 Change
¥43,457 ¥42,906 ¥551
Total non-current liabilities increased by ¥551 million to ¥43,457
million as of March 31, 2013, primarily due to an increase in the
provision for employees’ retirement benefits from ¥3,808 million to
¥4,714 million, and an increase in asset retirement obligations from
¥149 million to ¥800 million.
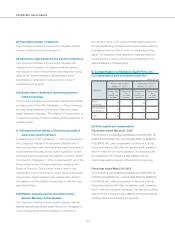
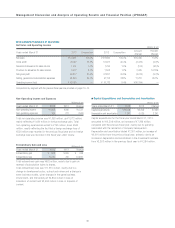
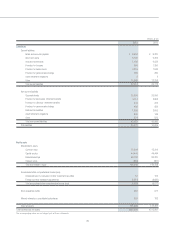
■ Shareholders’ Equity/Net Assets
Millions of yen
March 31 2013 2012 Change
Common stock ¥ 15,204 ¥ 15,204 ¥ —
Capital surplus 44,444 44,444 —
Retained earnings 68,153 85,320 (17,167)
Treasury stock (862) (861) (1)
Total shareholders’ equity 126,940 144,108 (17,168)
Unrealized gain (loss)
on revaluation of other
investment securities
57 124 (67)
Foreign currency translation
adjustments (6,911) (8,696) 1,785
Total accumulated other
comprehensive gain (loss) (6,853) (8,572) 1,719
Stock acquisition rights 652 977 (325)
Minority interests in
consolidated subsidiaries 897 783 114
Total net assets ¥121,636 ¥137,297 ¥(15,661)
As of March 31, 2013, total net assets amounted to ¥121,636
million, down ¥15,661 million compared with the previous fiscal
year, reflecting the occurrence of a net loss, payment of year-end
dividends (¥20 per share) for the previous fiscal year, and interim
dividends (¥10 per share) for the fiscal year under review.