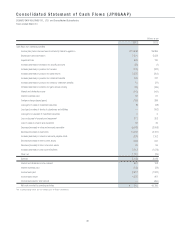
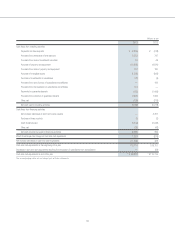
Square Enix 2013 Annual Report Download - page 33
Download and view the complete annual report
Please find page 33 of the 2013 Square Enix annual report below. You can navigate through the pages in the report by either clicking on the pages listed below, or by using the keyword search tool below to find specific information within the annual report.-
 1
1 -
2
-
3
-
4
-
5
-
6
-
7
-
8
-
9
-
10
-
11
-
12
-
13
-
14
-
15
-
16
-
17
-
18
-
19
-
20
-
21
-
22
-
 23
23 -
 24
24 -
 25
25 -
 26
26 -
 27
27 -
 28
28 -
 29
29 -
 30
30 -
 31
31 -
 32
32 -
 33
33 -
 34
34 -
 35
35 -
 36
36 -
 37
37 -
 38
38 -
 39
39 -
 40
40 -
 41
41 -
 42
42 -
 43
43 -
44
-
45
-
46
-
47
-
48
-
49
-
50
-
51
-
52
-
53
-
54
-
55
-
56
-
57
-
58
-
59
-
60
-
61
-
62
-
63
-
64
-
65
-
66
-
67
-
68
-
69
-
70
 |
 |

31
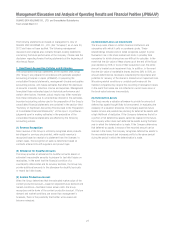
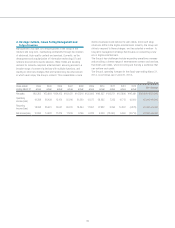
4. Strategic Outlook, Issues Facing Management and
Future Direction
Management’s key task is to ensure growth in the Group in the
medium and long term, maintaining profitability through the creation
of advanced, high-quality content and services. Currently, as the
development and popularization of information technology (IT) and
network environments rapidly advance, these trends are boosting
demand for network-compliant entertainment, ensuring access to a
broader range of content via devices with multiple functions, and
leading to other key changes that are transforming the environment
in which users enjoy the Group’s content. This necessitates a more
Millions of yen
Years ended/
ending March 31
2004
actual
2005
actual
2006
actual
2007
actual
2008
actual
2009
actual
2010
actual
2011
actual
2012
actual
2013
actual 2014 forecast
Net sales ¥63,202 ¥73,864 ¥124,473 ¥163,472 ¥147,516 ¥135,693 ¥192,257 ¥125,271 ¥127,896 ¥147,981 ¥140,000–¥150,000
Operating
income (loss) 19,398 26,438 15,470 25,916 21,520 12,277 28,235 7,325 10,713 (6,081) ¥5,000–¥9,000
Recurring
income (loss) 18,248 25,901 15,547 26,241 18,864 11,261 27,822 5,390 10,297 (4,378) ¥5,000–¥9,000
Net income (loss)
10,993 14,932 17,076 11,619 9,196 6,333 9,509 (12,043) 6,060 (13,714) ¥3,500–¥6,000
diverse business model tailored to user needs. Amid such large
structural shifts in the digital entertainment industry, the Group will
strive to respond to these changes, and has adopted a medium- to
long-term management strategy that focuses on pioneering a new
era in digital entertainment.
The Group’s key challenges include expanding operations overseas
and providing a diverse range of entertainment content and services
that meet user needs, while recruiting and training a workforce that
can achieve such goals.
The Group’s operating forecast for the fiscal year ending March 31,
2014, is as follows (as of June 30, 2013).