Square Enix 2013 Annual Report Download - page 32
Download and view the complete annual report
Please find page 32 of the 2013 Square Enix annual report below. You can navigate through the pages in the report by either clicking on the pages listed below, or by using the keyword search tool below to find specific information within the annual report.-
 1
1 -
2
-
3
-
4
-
5
-
6
-
7
-
8
-
9
-
10
-
11
-
12
-
13
-
14
-
15
-
16
-
17
-
18
-
19
-
20
-
21
-
 22
22 -
 23
23 -
 24
24 -
 25
25 -
 26
26 -
 27
27 -
 28
28 -
 29
29 -
 30
30 -
 31
31 -
 32
32 -
 33
33 -
 34
34 -
 35
35 -
 36
36 -
 37
37 -
 38
38 -
 39
39 -
 40
40 -
 41
41 -
 42
42 -
43
-
44
-
45
-
46
-
47
-
48
-
49
-
50
-
51
-
52
-
53
-
54
-
55
-
56
-
57
-
58
-
59
-
60
-
61
-
62
-
63
-
64
-
65
-
66
-
67
-
68
-
69
-
70
 |
 |
30
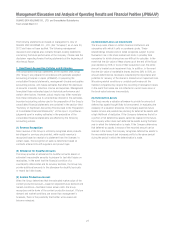
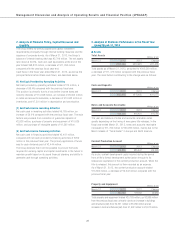
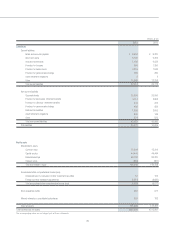
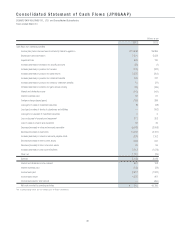
■ Consolidated Statement of Operations
Net Sales and Operating Income Millions of yen
Years ended March 31 2013 Composition 2012 Composition Amount
change
Percent
change
Net sales ¥147,98 1 10 0 .0% ¥127,8 9 6 100.0% ¥ 20,08 5 15.7 %
Gross profi t 49,192 33.2% 51,627 40.4% (2,435) (4.7)%
Reversal of allowance for sales returns 1,551 1.0% 1,706 1.3% (155) (9.1)%
Provision for allowance for sales returns 3,927 2.7% 1,502 1.2% 2,425 161.5%
Net gross profi t 46,817 31.6% 51,831 40.5% (5,014) (9.7)%
Selling, general and administrative expenses 52,899 35.7% 41,118 32.1% 11,781 28.7%
Operating income (loss) ¥ (6,081) — ¥ 10,713 8.4% ¥(16,794) —
Comparisons by segment with the previous fiscal year are provided on pages 10–13.
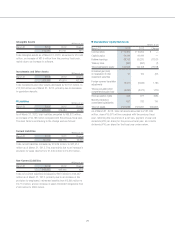
■ Capital Expenditures and Depreciation and Amortization
Millions of yen
Years ended March 31 2013 2012 Change
Capital expenditures ¥12,508 ¥5,209 ¥7,298
Depreciation and amortization
7,3 01 5,03 9 2, 261
Capital expenditures for the fiscal year ended March 31, 2013,
amounted to ¥12,508 million, an increase of ¥7,298 million
compared with the previous fiscal year, mainly due to spending
associated with the relocation of Company headquarters.
Depreciation and amortization totaled ¥7,301 million, an increase of
¥2,261 million from the previous fiscal year, primarily due to an
increase in depreciation and amortization in the Amusement business
from ¥3,363 million in the previous fiscal year to ¥4,384 million.
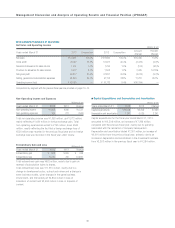
Non-Operating Income and Expenses
Millions of yen
Years ended March 31 2013 2012 Change
Non-operating income ¥1,858 ¥286 ¥1,572
Non-operating expenses 155 701 (546)
Total non-operating income was ¥1,858 million, up ¥1,572 million,
mainly reflecting ¥1,620 million in foreign exchange gain. Total
non-operating expenses amounted to ¥155 million, down ¥546
million, mostly reflecting the fact that a foreign exchange loss of
¥536 million was recorded in the previous fiscal year and no foreign
exchange loss was recorded in the fiscal year under review.
Extraordinary Gain and Loss Millions of yen
Years ended March 31 2013 2012 Change
Extraordinary gain ¥ 653 ¥ 305 ¥ 348
Extraordinary loss 11,210 741 10,469
Total extraordinary gain was ¥653 million, mainly due to gain on
reversal of subscription rights to shares.
Total extraordinary loss was ¥11,210 million, mainly due to a
change in development policy, a structural review and a change in
some business models, given changes in the game business
environment, and the booking of ¥4,834 million in loss on
evaluation of content and ¥3,696 million in loss on disposal of
content.
Management Discussion and Analysis of Operating Results and Financial Position (JPNGAAP)