Square Enix 2013 Annual Report Download - page 3
Download and view the complete annual report
Please find page 3 of the 2013 Square Enix annual report below. You can navigate through the pages in the report by either clicking on the pages listed below, or by using the keyword search tool below to find specific information within the annual report.-
 1
1 -
 2
2 -
 3
3 -
 4
4 -
 5
5 -
 6
6 -
 7
7 -
 8
8 -
 9
9 -
 10
10 -
 11
11 -
 12
12 -
 13
13 -
 14
14 -
15
-
16
-
17
-
18
-
19
-
20
-
21
-
22
-
23
-
24
-
25
-
26
-
27
-
28
-
29
-
30
-
31
-
32
-
33
-
34
-
35
-
36
-
37
-
38
-
39
-
40
-
41
-
42
-
43
-
44
-
45
-
46
-
47
-
48
-
49
-
50
-
51
-
52
-
53
-
54
-
55
-
56
-
57
-
58
-
59
-
60
-
61
-
62
-
63
-
64
-
65
-
66
-
67
-
68
-
69
-
70
 |
 |

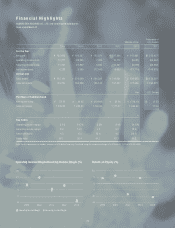
Note: For the convenience of readers, amounts in U.S. dollars have been translated using the currency exchange rate at March 31, 2013 of ¥94.05=US$1.
2009 2010 2011 2012 2013 2013
For the Year
Net sales ¥ 135,693 ¥ 192,257 ¥ 125,271 ¥ 127,896 ¥ 147,981 $1,573,437
Operating income (loss) 12,277 28,235 7,325 10,713 (6,081) (64,667)
Recurring income (loss) 11,261 27,822 5,390 10,297 (4,378) (46,552)
Net income (loss) 6,333 9,509 (12,043) 6,060 (13,714) (145,825)
At Year-end
Total assets ¥ 213,194 ¥ 270,529 ¥ 206,336 ¥ 213,981 ¥ 202,509 $2,153,207
Total net assets 148,724 154,258 135,143 137,297 121,636 1,293,321
Yen U.S. Dollars
Per Share of Common Stock
Net income (loss) ¥ 55.11 ¥ 82.65 ¥ (104.66) ¥ 52.66 ¥ (119.19) $ (1.27)
Total net assets 1,280.92 1,326.82 1,160.66 1,177.87 1,043.62 11.00
%
Key Ratios
Operating income margin 9.0% 14.7% 5.8% 8.4% (4.1)%
Recurring income margin 8.3 14.5 4.3 8.0 (2.9)
Return on equity 4.3 6.3 (8.4) 4.5 (10.7)
Equity ratio 69.1 56.4 64.7 63.3 59.3
Thousands of
U.S. DollarsMillions of Yen
Operating Income Margin/Recurring Income Margin (%)
20
15
10
5
0
-5
2011 20122009 2010
Return on Equity (%)
10
5
0
-5
-10
-15
2011 20122013 20132009 2010
Operating Income Margin Recurring Income Margin
Financial Highlights
SQUARE ENIX HOLDINGS CO., LTD. and Consolidated Subsidiaries
Years ended March 31
01