Square Enix 2013 Annual Report Download - page 13
Download and view the complete annual report
Please find page 13 of the 2013 Square Enix annual report below. You can navigate through the pages in the report by either clicking on the pages listed below, or by using the keyword search tool below to find specific information within the annual report.-
 1
1 -
2
-
 3
3 -
 4
4 -
 5
5 -
 6
6 -
 7
7 -
 8
8 -
 9
9 -
 10
10 -
 11
11 -
 12
12 -
 13
13 -
 14
14 -
 15
15 -
 16
16 -
 17
17 -
 18
18 -
 19
19 -
 20
20 -
 21
21 -
 22
22 -
 23
23 -
24
-
25
-
26
-
27
-
28
-
29
-
30
-
31
-
32
-
33
-
34
-
35
-
36
-
37
-
38
-
39
-
40
-
41
-
42
-
43
-
44
-
45
-
46
-
47
-
48
-
49
-
50
-
51
-
52
-
53
-
54
-
55
-
56
-
57
-
58
-
59
-
60
-
61
-
62
-
63
-
64
-
65
-
66
-
67
-
68
-
69
-
70
 |
 |
The Digital Entertainment segment plans, develops, distributes and operates
digital entertainment content primarily in the form of games. Digital entertainment
content is offered to meet customer lifestyles across a variety of usage
environments such as consumer game consoles (including handheld game
machines), personal computers and mobile phones (including smartphones).
During the fiscal year ended March 31, 2013, the Group’s operating income
decreased significantly, primarily due to underperformance of major titles for
consumer game consoles in North America and Europe.
Regarding content on platforms such as browsers and smartphones,
“SENGOKU IXA,” a browser game, and “FINAL FANTASY BRIGADE,” a Mobage-
based social game, are continuously contributing to the profit of this segment.
“Kaku-San-Sei Million Arthur,” a social game released in April 2012, has been
successful not only in the domestic market, but also in Korea, where the game
has become an instant hit since its launch in December 2012. In this manner,
new titles are expanding satisfactorily.
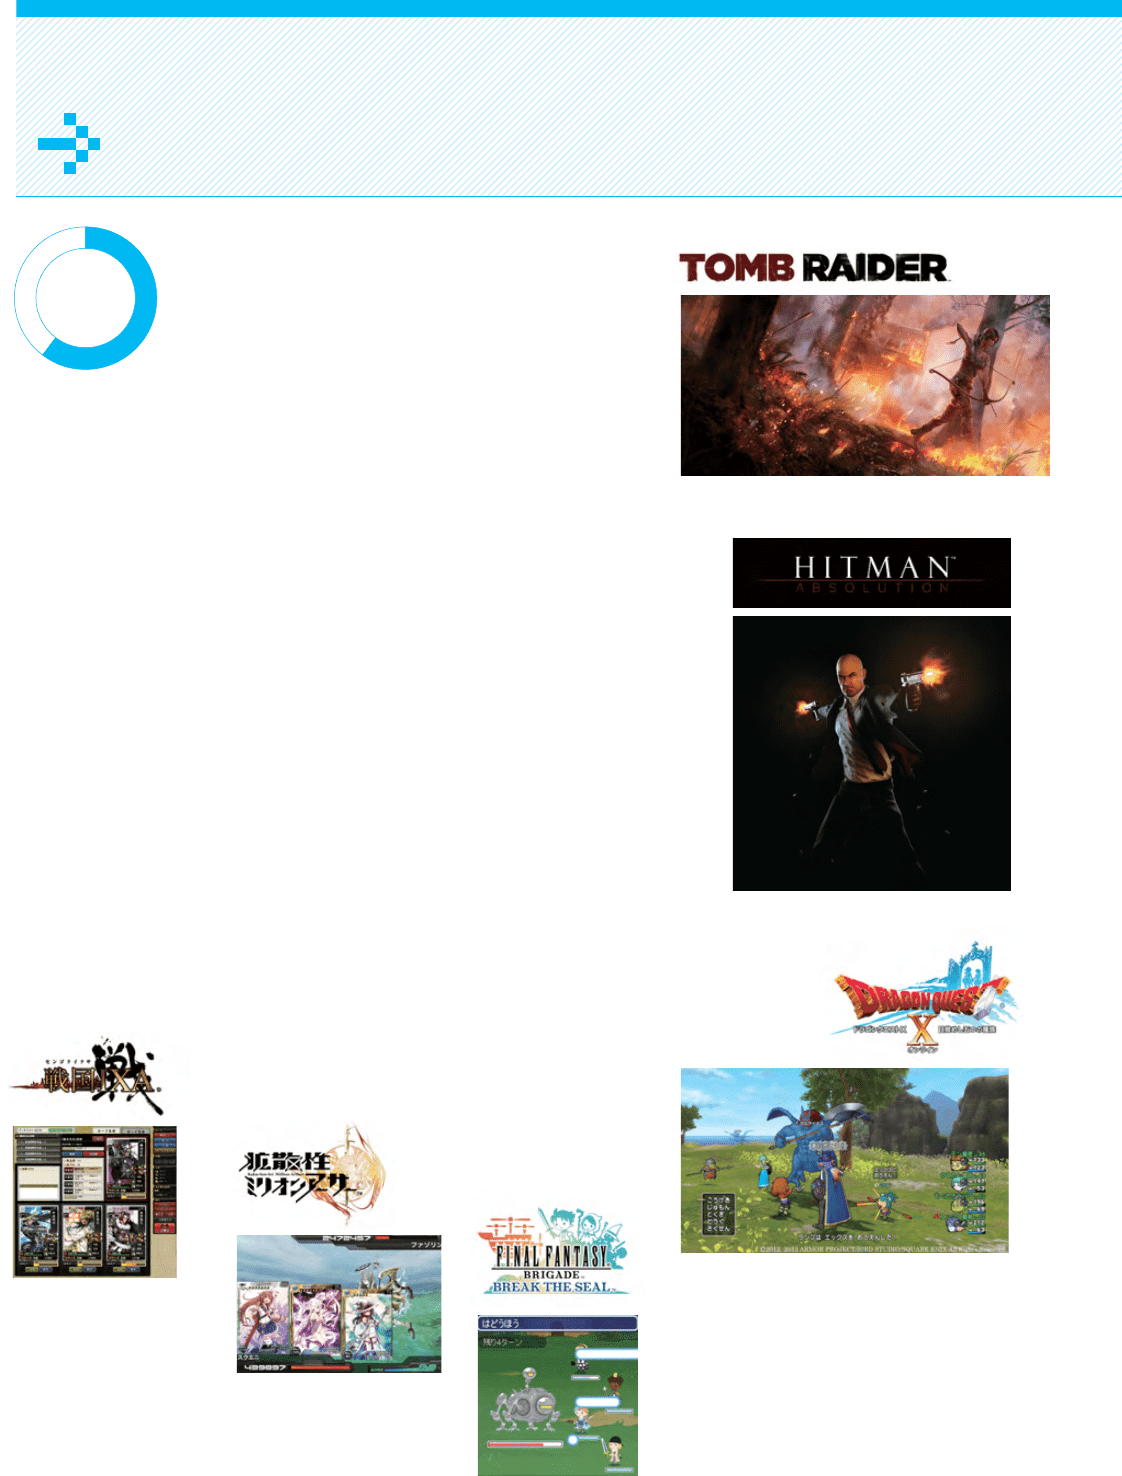
“DRAGON QUEST X,” the major MMORPG released in August 2012, has
been showing steady performance.
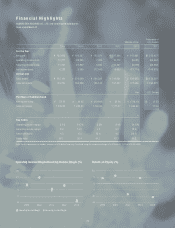
Net sales and operating income in the Digital Entertainment segment totaled
¥89,482 million (an increase of 24.5% from the prior fiscal year) and ¥44 million
(a decrease of 99.7% from the prior fiscal year), respectively.
Digital Entertainment
Share of Net Sales (FY ended March 2013)
60.4%
©SQUARE ENIX CO., LTD. All Rights Reserved.
©DeNA Co., Ltd. All rights reserved.
©SQUARE ENIX LTD. All Rights Reserved.
©2011 IO INTERACTIVE A/S. All Rights Reserved.
©2012, 2013 ARMOR PROJECT/BIRD STUDIO/SQUARE ENIX
All Rights Reserved.
©2010-2013 SQUARE ENIX CO., LTD.
All Rights Reserved.
©2012, 2013 SQUARE ENIX CO., LTD.
All Rights Reserved.
11