Square Enix 2013 Annual Report Download - page 38
Download and view the complete annual report
Please find page 38 of the 2013 Square Enix annual report below. You can navigate through the pages in the report by either clicking on the pages listed below, or by using the keyword search tool below to find specific information within the annual report.-
 1
1 -
2
-
3
-
4
-
5
-
6
-
7
-
8
-
9
-
10
-
11
-
12
-
13
-
14
-
15
-
16
-
17
-
18
-
19
-
20
-
21
-
22
-
23
-
24
-
25
-
26
-
27
-
 28
28 -
 29
29 -
 30
30 -
 31
31 -
 32
32 -
 33
33 -
 34
34 -
 35
35 -
 36
36 -
 37
37 -
 38
38 -
 39
39 -
 40
40 -
 41
41 -
 42
42 -
 43
43 -
 44
44 -
 45
45 -
 46
46 -
 47
47 -
 48
48 -
49
-
50
-
51
-
52
-
53
-
54
-
55
-
56
-
57
-
58
-
59
-
60
-
61
-
62
-
63
-
64
-
65
-
66
-
67
-
68
-
69
-
70
 |
 |
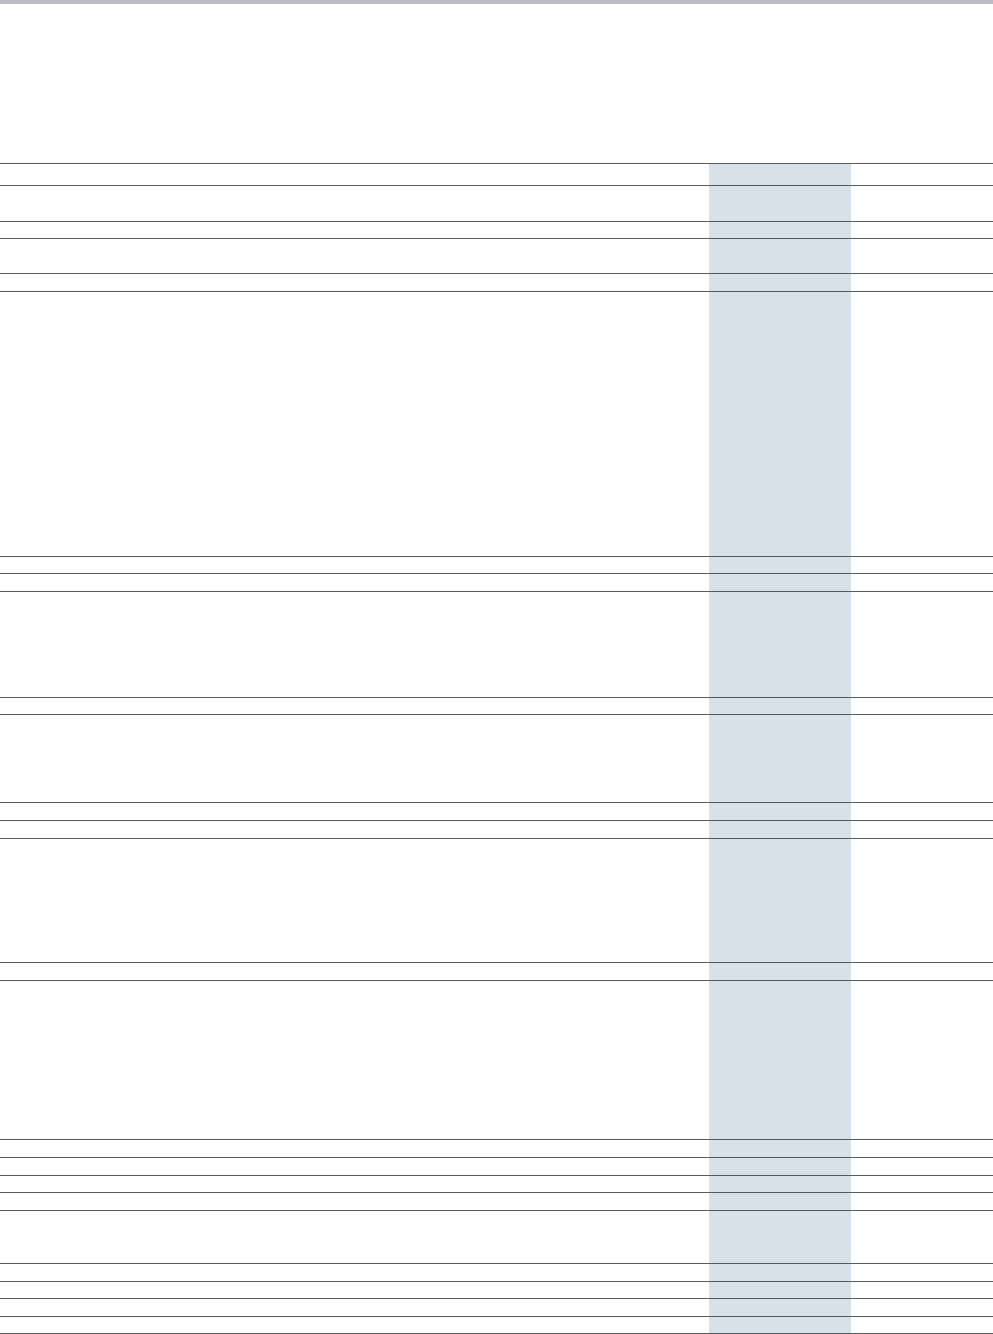
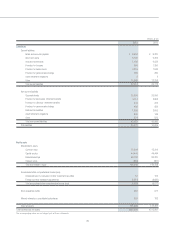
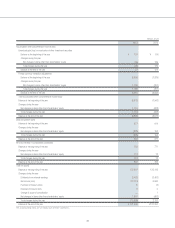
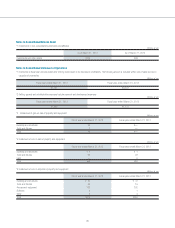
Consolidated Statement of Operations (JPNGAAP)
SQUARE ENIX HOLDINGS CO., LTD. and Consolidated Subsidiaries
Years ended March 31
Millions of yen
2013 2012
Net sales ¥147,981 ¥127,896
Cost of sales *1 98,788 *1 76,268
Gross profi t 49,192 51,627
Reversal of provision for sales returns 1,551 1,706
Provision for sales returns 3,927 1,502
Net gross profi t 46,817 51,831
Selling, general and administrative expenses
Packaging freight charge 1,867 1,812
Advertising expense 12,309 7,258
Sales promotion expense 100 63
Allowance for doubtful accounts —67
Compensation for directors 607 541
Salaries 14,105 12,195
Provision for bonuses 1,483 1,814
Net periodic pension costs 1,484 1,288
Provision for directors’ retirement benefi ts 12 13
Welfare expense 1,710 1,523
Rental expense 1,554 1,616
Commission fee 7,588 4,621
Depreciation and amortization 2,091 1,000
Other *2 7,984 *2 7,298
Total selling, general and administrative expenses 52,899 41,118
Operating income (loss) (6,081) 10,713
Non-operating income
Interest income 100 136
Dividends received 94
Rental income 14 17
Foreign exchange gain 1,620 —
Miscellaneous income 114 127
Total non-operating income 1,858 286
Non-operating expenses
Interest expenses 98 61
Commission fee 53 100
Foreign exchange loss — 536
Miscellaneous loss 33
Total non-operating expenses 155 701
Recurring income (loss) (4,378) 10,297
Extraordinary gain
Gain on sale of property and equipment *3 2—
Gain on sale of investment securities 848
Gain on sale of stocks of subsidiaries and affi liates — 192
Gain on liquidation of subsidiaries and affi liates 76 —
Gain on reversal of subscription rights to shares 445 46
Other 120 18
Total extraordinary gain 653 305
Extraordinary loss
Loss on sale of property and equipment *4 58 *4 30
Loss on disposal of property and equipment *5 213 *5 352
Loss on evaluation of investment securities *6 0*6 0
Impairment loss *7 939 *7 130
Provision for game arcade closings 60 78
Loss on disposal of content *9 3,696 *9 93
Loss on evaluation of content *9 4,834 —
Other 1,406 55
Total extraordinary loss 11,210 741
Income (loss) before dividends distribution from silent partnership, income taxes (tokumei-kumiai ) (14,934) 9,862
Dividends distribution from silent partnership (tokumei-kumiai ) 13 (4)
Income (loss) before income taxes and minority interests (14,948) 9,866
Income taxes–current 957 3,763
Refund of income taxes — (50)
Income taxes–deferred (2,208) 79
Total income taxes (1,250) 3,792
Income (loss) before minority interests (13,697) 6,074
Minority interests income (loss) 17 13
Net income (loss) ¥ (13,714) ¥ 6,060
The accompanying notes are an integral part of these statements.
36