Square Enix 2010 Annual Report Download - page 60
Download and view the complete annual report
Please find page 60 of the 2010 Square Enix annual report below. You can navigate through the pages in the report by either clicking on the pages listed below, or by using the keyword search tool below to find specific information within the annual report.-
 1
1 -
2
-
3
-
4
-
5
-
6
-
7
-
8
-
9
-
10
-
11
-
12
-
13
-
14
-
15
-
16
-
17
-
18
-
19
-
20
-
21
-
22
-
23
-
24
-
25
-
26
-
27
-
28
-
29
-
30
-
31
-
32
-
33
-
34
-
35
-
36
-
37
-
38
-
39
-
40
-
41
-
42
-
43
-
44
-
45
-
46
-
47
-
48
-
49
-
 50
50 -
 51
51 -
 52
52 -
 53
53 -
 54
54 -
 55
55 -
 56
56 -
 57
57 -
 58
58 -
 59
59 -
 60
60 -
 61
61 -
 62
62 -
 63
63 -
 64
64 -
 65
65 -
 66
66 -
 67
67 -
 68
68
 |
 |

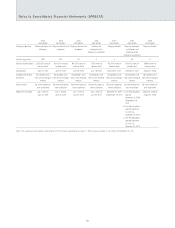
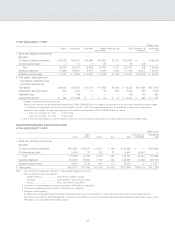
Notes to Consolidated Financial Statements (JPNGAAP)
■ Year ended March 31, 2010
Millions of yen
North Eliminations or Consolidated
Japan America Europe Asia Total unallocated total
I Sales and operating income (loss)
Net sales
(1) Sales to external customers ¥143,293 ¥25,389 ¥23,271 ¥ 302 ¥192,257 ¥ — ¥192,257
(2) Intersegment sales 7,774 3,162 4,958 91 15,985 (15,985) —
Total 151,067 28,551 28,229 394 208,243 (15,985) 192,257
Operating expenses 124,703 25,334 29,599 375 180,014 (15,991) 164,022
Operating income (loss) 26,363 3,216 (1,369) 18 28,229 6 28,235
II Total assets ¥239,705 ¥33,599 ¥36,804 ¥1,703 ¥311,812 ¥(41,283) ¥270,529
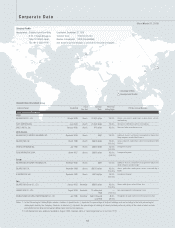
Notes: 1. The classification of geographic segments is made based on geographical distance.
2. Main countries included in each segment:
(1) North America........................... United States of America, Canada
(2) Europe..................................... United Kingdom, France, Germany, others
(3) Asia......................................... China, South Korea, Taiwan, others
3. There were no unallocated operating expenses included in “Eliminations or unallocated.”
4. There were no unallocated assets included in “Eliminations or unallocated.”
5. In this fiscal year, due to the acquisition of the shares of EIDOS LTD., Canada has been added to the North America segment and France, Germany and others have
been added to the Europe segment.
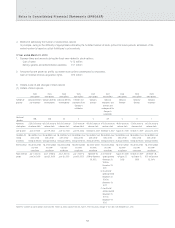
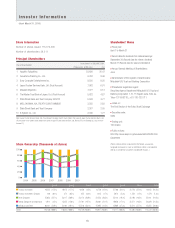
[Consolidated Overseas Sales]
■ Year ended March 31, 2009
Millions of yen
North America Europe Asia Total
I Overseas sales ¥14,285 ¥6,713 ¥1,298 ¥ 22,297
II Consolidated sales — — — 135,693
III Overseas sales as a percentage of consolidated sales 10.5% 5.0% 1.0% 16.5%
Notes: 1. The classification of geographic segments is made based on geographical distance.
2. Main countries included in each segment:
(1) North America........................... United States of America, Canada
(2) Europe..................................... United Kingdom, France, Germany, others
(3) Asia......................................... China, South Korea, Taiwan, others
3. Overseas sales represent sales of the Company and its consolidated subsidiaries to countries and areas outside Japan.
■ Year ended March 31, 2010
Millions of yen
North America Europe Asia Total
I Overseas sales ¥26,315 ¥23,523 ¥1,260 ¥ 51,099
II Consolidated sales — — — 192,257
III Overseas sales as a percentage of consolidated sales 13.7% 12.2% 0.7% 26.6%
Notes: 1. The classification of geographic segments is made based on geographical distance.
2. Main countries included in each segment:
(1) North America........................... United States of America, Canada
(2) Europe..................................... United Kingdom, France, Germany, others
(3) Asia......................................... China, South Korea, Taiwan, others
3. Overseas sales represent sales of the Company and its consolidated subsidiaries to countries and areas outside Japan.
58