Square Enix 2010 Annual Report Download - page 58
Download and view the complete annual report
Please find page 58 of the 2010 Square Enix annual report below. You can navigate through the pages in the report by either clicking on the pages listed below, or by using the keyword search tool below to find specific information within the annual report.-
 1
1 -
2
-
3
-
4
-
5
-
6
-
7
-
8
-
9
-
10
-
11
-
12
-
13
-
14
-
15
-
16
-
17
-
18
-
19
-
20
-
21
-
22
-
23
-
24
-
25
-
26
-
27
-
28
-
29
-
30
-
31
-
32
-
33
-
34
-
35
-
36
-
37
-
38
-
39
-
40
-
41
-
42
-
43
-
44
-
45
-
46
-
47
-
 48
48 -
 49
49 -
 50
50 -
 51
51 -
 52
52 -
 53
53 -
 54
54 -
 55
55 -
 56
56 -
 57
57 -
 58
58 -
 59
59 -
 60
60 -
 61
61 -
 62
62 -
 63
63 -
 64
64 -
 65
65 -
 66
66 -
 67
67 -
 68
68
 |
 |

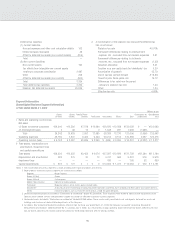
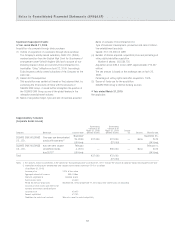
Notes to Consolidated Financial Statements (JPNGAAP)
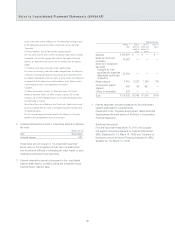
■ Year ended March 31, 2010
Millions of yen
Games Amusement Publication Mobile Merchandising Total Eliminations or Consolidated
phone content unallocated total
I Sales and operating income (loss)
Net sales
(1) Sales to external customers ¥109,948 ¥52,299 ¥14,367 ¥10,171 ¥5,470 ¥192,257 ¥ — ¥ 192,257
(2) Intersegment sales 1 — — 0 2 3 (3) —
Total 109,949 52,299 14,367 10,171 5,473 192,261 (3) 192,257
Operating expenses 86,135 49,406 10,247 5,578 3,645 155,013 9,008 164,022
Operating income (loss) ¥ 23,814 ¥ 2,892 ¥ 4,120 ¥ 4,593 ¥1,827 ¥ 37,248 ¥ (9,012) ¥ 28,235
II Total assets, depreciation and
amortization, impairment loss
and capital expenditures
Total assets ¥ 92,502 ¥ 36,266 ¥10,033 ¥ 3,826 ¥4,025 ¥146,654 ¥123,874 ¥270,529
Depreciation and amortization 2,341 4,828 14 41 15 7,241 721 7,962
Impairment loss — 74 — — — 74 181 255
Capital expenditures ¥ 935 ¥ 5,476 ¥ 6 ¥ 23 ¥ 1 ¥ 6,443 ¥ 473 ¥ 6,916
Notes: 1. The classification of business segments is made according to the types of products and services.
2. Principal products and services provided by each business segment are summarized as follows:
Segment Principal products and services
Games Games, online games
Amusement Amusement facility operation and rental, sales of amusement game machines
Publication Magazine comics, serial comics, game-related books
Mobile Phone Content Content for mobile phones
Merchandising Derivative products such as character merchandise
3. Unallocated operating expenses included in “Eliminations or unallocated” totaled ¥9,078 million. These expenses were related to administrative departments of the
Company which provide services and operational support that cannot be allocated to specific business segments.
4. Unallocated assets included in “Eliminations or unallocated” totaled ¥123,946 million. These assets mainly comprised cash and deposits, deferred tax assets and
buildings and structures of administrative departments of the Company.
5. As described in the notes to Consolidated Statements of Income *8, the Company recorded accelerated amortization of goodwill.
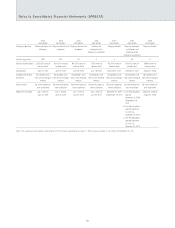
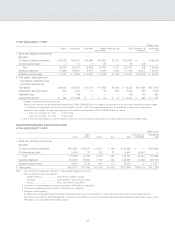
6. Previously, the Group classified its businesses into the following segments: Games (offline), Games (online), Mobile Phone Content, Publication, Amusement and
Others. Under the holding company structure established in October 2008, each business segment has undertaken efforts to strengthen its underlying business base
and bolster profit-generating capabilities. Driven by changes in its corporate structure as well as measures aimed at building and reinforcing its business base, the
Group decided to change its business segment classifications, effective this fiscal year, to the following: Games, Amusement, Publication, Mobile Phone Content and
Merchandising. Consolidated business segment information for the previous fiscal year based on the business segment classifications used for this fiscal year is as
follows:
56