Square Enix 2010 Annual Report Download - page 59
Download and view the complete annual report
Please find page 59 of the 2010 Square Enix annual report below. You can navigate through the pages in the report by either clicking on the pages listed below, or by using the keyword search tool below to find specific information within the annual report.-
 1
1 -
2
-
3
-
4
-
5
-
6
-
7
-
8
-
9
-
10
-
11
-
12
-
13
-
14
-
15
-
16
-
17
-
18
-
19
-
20
-
21
-
22
-
23
-
24
-
25
-
26
-
27
-
28
-
29
-
30
-
31
-
32
-
33
-
34
-
35
-
36
-
37
-
38
-
39
-
40
-
41
-
42
-
43
-
44
-
45
-
46
-
47
-
48
-
 49
49 -
 50
50 -
 51
51 -
 52
52 -
 53
53 -
 54
54 -
 55
55 -
 56
56 -
 57
57 -
 58
58 -
 59
59 -
 60
60 -
 61
61 -
 62
62 -
 63
63 -
 64
64 -
 65
65 -
 66
66 -
 67
67 -
 68
68
 |
 |

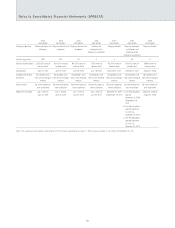
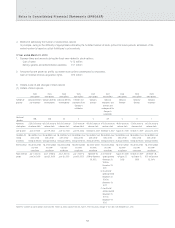
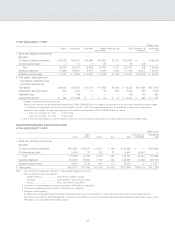
■ Year ended March 31, 2009
Millions of yen
Games Amusement Publication Mobile Merchandising Total Eliminations or Consolidated
phone content unallocated total
I Sales and operating income (loss)
Net sales
(1) Sales to external customers ¥48,132 ¥59,915 ¥12,984 ¥10,903 ¥3,757 ¥135,693 ¥ — ¥135,693
(2) Intersegment sales 4 0 0 23 — 28 (28) —
Total 48,136 59,915 12,985 10,926 3,757 135,721 (28) 135,693
Operating expenses 41,408 56,634 9,447 6,678 2,942 117,108 6,307 123,415
Operating income (loss) ¥ 6,727 ¥ 3,281 ¥ 3,540 ¥ 4,248 ¥ 815 ¥ 18,613 ¥ (6,335) ¥ 12,277
II Total assets, depreciation and
amortization, impairment loss
and capital expenditures
Total assets ¥48,929 ¥ 23,503 ¥ 9,074 ¥ 4,089 ¥6,908 ¥ 92,505 ¥120,689 ¥213,194
Depreciation and amortization 874 4,421 13 58 656 6,024 953 6,978
Impairment loss — 758 — — — 758 100 859
Capital expenditures ¥ 482 ¥11,899 ¥ 2 ¥ 35 ¥ 27 ¥ 12,447 ¥ 684 ¥ 13,131
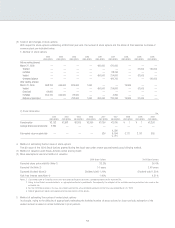
7. Changes in allocation of operating expenses:
While all of the expenses for the administration department of TAITO CORPORATION was included in the Amusement in the past, these expenses have been included
in “Eliminations or unallocated” since the first quarter ended in June 30, 2009. The changes to allocation was made to deliver a clearer view of administrate
expenses in each segment. The operating expenses for the administration department of TAITO CORPORATION are as follows:
Fiscal year ended Mar. 31, 2010 ¥2,220 million
Fiscal year ended Mar. 31, 2009 ¥1,810 million
8. Due to the acquisition of Edios Ltd. in the first quarter of this fiscal year, the amount of total assets for the Game segment increased by ¥35,864 million.
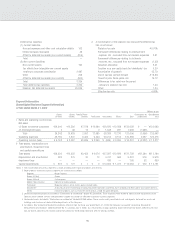
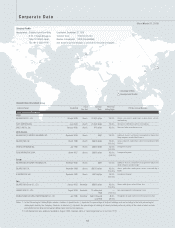
[Consolidated Geographic Segment Information]
■ Year ended March 31, 2009
Millions of yen
North Eliminations or Consolidated
Japan America Europe Asia Total unallocated total
I Sales and operating income (loss)
Net sales
(1) Sales to external customers ¥115,681 ¥13,247 ¥ 6,417 ¥ 346 ¥135,693 ¥ — ¥135,693
(2) Intersegment sales 5,908 175 302 21 6,407 (6,407) —
Total 121,590 13,423 6,720 367 142,101 (6,407) 135,693
Operating expenses 112,949 10,694 5,733 444 129,821 (6,405) 123,415
Operating income (loss) 8,640 2,728 987 (77) 12,279 (1) 12,277
II Total assets ¥202,370 ¥15,785 ¥18,108 ¥1,639 ¥237,904 ¥(24,710) ¥213,194
Notes: 1. The classification of geographic segments is made based on geographical distance.
2. Main countries included in each segment:
(1) North America........................... United States of America, Canada
(2) Europe..................................... United Kingdom, France, Germany, others
(3) Asia......................................... China, South Korea, Taiwan, others
3. There were no unallocated operating expenses included in “Eliminations or unallocated.”
4. There were no unallocated assets included in “Eliminations or unallocated.”
5. Change in accounting policy
As noted in New Accounting Standard (Inventories), effective from the fiscal year ended March 31, 2009, the Company has applied “Accounting Standard for
Measurement of Inventories” (ASBJ Statement No. 9, issued on July 5, 2006). As a result of this change, operating income decreased by ¥645 million in Japan and by
¥39 million in Asia compared with the previous method.
57