Square Enix 2010 Annual Report Download - page 26
Download and view the complete annual report
Please find page 26 of the 2010 Square Enix annual report below. You can navigate through the pages in the report by either clicking on the pages listed below, or by using the keyword search tool below to find specific information within the annual report.-
 1
1 -
2
-
3
-
4
-
5
-
6
-
7
-
8
-
9
-
10
-
11
-
12
-
13
-
14
-
15
-
 16
16 -
 17
17 -
 18
18 -
 19
19 -
 20
20 -
 21
21 -
 22
22 -
 23
23 -
 24
24 -
 25
25 -
 26
26 -
 27
27 -
 28
28 -
 29
29 -
 30
30 -
 31
31 -
 32
32 -
 33
33 -
 34
34 -
 35
35 -
 36
36 -
37
-
38
-
39
-
40
-
41
-
42
-
43
-
44
-
45
-
46
-
47
-
48
-
49
-
50
-
51
-
52
-
53
-
54
-
55
-
56
-
57
-
58
-
59
-
60
-
61
-
62
-
63
-
64
-
65
-
66
-
67
-
68
 |
 |
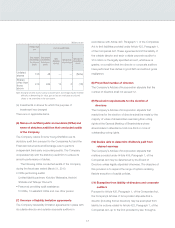
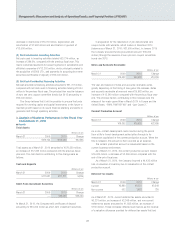
■ Shareholders’ Equity/Net Assets
Millions of yen
March 31 2009 2010 Change
Common stock ¥ 15,134 ¥ 15,204 ¥ 69
Capital surplus 44,375 44,444 69
Retained earnings 93,220 98,848 5,627
Treasury stock (852) (856) (3)
Total shareholders’ equity 151,879 157,641 5,762
Unrealized gain on
revaluation of other
investment securities
(71) (9) 62
Foreign currency translation
adjustments (4,488) (4,951) (462)
Total valuation and translation
adjustments (4,560) (4,960) (399)
Stock acquisition rights 410 715 304
Minority interests in
consolidated subsidiaries 995 861 (133)
Total net assets ¥148,724 ¥154,258 ¥5,533
As of March 31, 2010, total shareholders’ equity amounted to
¥157,641 million, an increase of ¥5,762 million compared with the
previous fiscal year-end. Common stock and capital surplus
increased owing to the exercise of stock options (stock acquisition
rights).
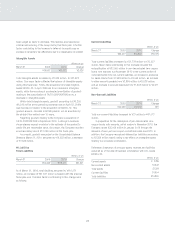
■ Consolidated Statements of Income
Net Sales and Operating Income
Millions of yen
Years ended March 31 2009 Composition 2010 Composition Amount
change
Percent
change
Net sales ¥135,693 100.0% ¥192,257 100.0% ¥56,563 41.7%
Gross profi t 56,166 41.4% 83,721 43.5% 27,555 49.1%
Reversal of allowance for sales returns 1,135 0.8% 4,863 2.5% 3,727 328.1%
Provision for allowance for sales returns 1,598 1.2% 4,046 2.1% 2,448 153.2%
Net gross profi t 55,703 41.1% 84,538 44.0% 28,834 51.8%
Selling, general and administrative expenses 43,426 32.0% 56,303 29.3% 12,877 29.7%
Operating income 12,277 9.0% 28,235 14.7% 15,957 130.0%
Comparisons by segment with the preceding fiscal year are provided on pages 8–11.
Management’s Discussion and Analysis of Operating Results and Financial Position (JPNGAAP)
In the previous fiscal year, foreign exchange loss amounted to
¥1,715 million.
Non-Operating Income and Expenses
Millions of yen
Years ended March 31 2009 2010 Change
Non-operating income ¥ 909 ¥ 758 ¥(150)
Non-operating expenses 1,925 1,171 (754)
Non-operating income decreased by ¥150 million, to ¥758 million,
mainly owing to a decrease in interest income.
Non-operating expenses amounted to ¥1,171 million, primarily
owing to a foreign exchange loss of ¥842 million.
24