Square Enix 2010 Annual Report Download - page 41
Download and view the complete annual report
Please find page 41 of the 2010 Square Enix annual report below. You can navigate through the pages in the report by either clicking on the pages listed below, or by using the keyword search tool below to find specific information within the annual report.-
 1
1 -
2
-
3
-
4
-
5
-
6
-
7
-
8
-
9
-
10
-
11
-
12
-
13
-
14
-
15
-
16
-
17
-
18
-
19
-
20
-
21
-
22
-
23
-
24
-
25
-
26
-
27
-
28
-
29
-
30
-
 31
31 -
 32
32 -
 33
33 -
 34
34 -
 35
35 -
 36
36 -
 37
37 -
 38
38 -
 39
39 -
 40
40 -
 41
41 -
 42
42 -
 43
43 -
 44
44 -
 45
45 -
 46
46 -
 47
47 -
 48
48 -
 49
49 -
 50
50 -
 51
51 -
52
-
53
-
54
-
55
-
56
-
57
-
58
-
59
-
60
-
61
-
62
-
63
-
64
-
65
-
66
-
67
-
68
 |
 |

■ Year ended March 31, 2010
*1 Investments in non-consolidated subsidiaries and affiliates:
Investments and other assets ¥69 million
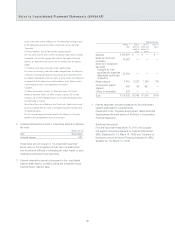
Notes to Consolidated Statements of Income
■ Year ended March 31, 2009
*1 Inventories at fiscal year-end are stated after writing down
inventory based on its decrease in profitability. The following
amount is included within cost of sales as loss on valuation of
inventories ¥5,368 million
*2 Selling, general and administrative expenses include research
and development expenses of ¥1,525 million.
*3 Breakdown of gain on sale of property and equipment
Not applicable
*4 Breakdown of loss on sale of property and equipment
Tools and fixtures ¥ 7 million
Amusement equipment 19 million
Total ¥26 million
*5 Breakdown of loss on disposal of property and equipment
Buildings and structures ¥102 million
Tools and fixtures 216 million
Amusement equipment 342 million
Software 9 million
Other 118 million
Total ¥790 million
*6 Loss on valuation of investment securities was due to a signifi-
cant decline in market prices of marketable securities.
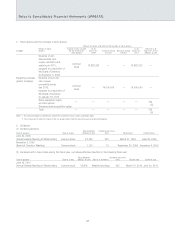
*7 Impairment loss
In the fiscal year ended March 31, 2009, the Group posted
impairment losses on the following groups of assets:
Millions of yen
Impairment
Location Usage Category amount
Kawasaki-shi, Idle assets Buildings and ¥ 63
Kanagawa structure
Kawasaki-shi, Idle assets Land 28
Kanagawa
Sendai-shi, Miyagi Sales office Buildings 39
Sendai-shi, Miyagi Sales office Land 238
Shibuya-ku, Tokyo Idle assets Telephone 8
and other subscription rights
Shibuya-ku, Tokyo Amusement Amusement 481
and other facilities equipment
Total ¥859
Cash inflows from each business segment of the Group are comple-
mentary to one another in terms of similarities in the nature of prod-
ucts, merchandise, services and markets. Consequently, all assets
for operational purposes are classified in one asset group, and idle
assets that are not used for operational purposes are classified indi-
vidually. In addition, assets related to the Group’s headquarters and
welfare facilities are classified as common-use assets.
Of the assets listed above, land, buildings, telephone subscrip-
tion rights and amusement equipment were idle assets and their
market value had fallen substantially below their book value. Since
they were not expected to be used in the future, they were marked
down to their recoverable value, resulting in an impairment loss of
¥859 million, which was posted as an extraordinary loss. In principle,
the recoverable amounts for these assets are determined based on
their fair value calculated using market prices.
*8 Amortization of goodwill
Not applicable
*9 Loss associated with business restructuring
Not applicable
*10 Income tax for prior periods
Not applicable
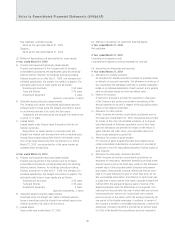
■ Year ended March 31, 2010
*1 Inventories at fiscal year-end are stated after writing down
inventory based on its decrease in profitability. The following
amount is included within cost of sales as loss on valuation of
inventories ¥6,640 million
*2 Selling, general and administrative expenses include research
and development expenses of ¥1,243 million
*3 Breakdown of gain on sale of property and equipment
Buildings and structures ¥ 31 million
Tools and fixtures 0 million
Amusement equipment 1 million
Other 0 million
Total ¥ 33 million
*4 Breakdown of loss on sale of property and equipment
Tools and fixtures ¥ 52 million
Buildings and structures 16 million
Amusement equipment 0 million
Total ¥ 69 million
*5 Breakdown of loss on disposal of property and equipment
Buildings and structures ¥ 78 million
Tools and fixtures 34 million
Amusement equipment 268 million
Software 4 million
Other 3 million
Total ¥389 million
*6 Loss on valuation of investment securities
Same as the year ended March 31, 2009
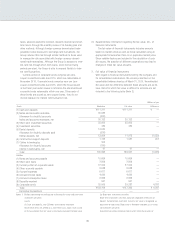
*7 Impairment loss
In the fiscal year ended March 31, 2010, the Group posted
impairment losses on the following groups of assets:
39