Square Enix 2010 Annual Report Download - page 5
Download and view the complete annual report
Please find page 5 of the 2010 Square Enix annual report below. You can navigate through the pages in the report by either clicking on the pages listed below, or by using the keyword search tool below to find specific information within the annual report.-
 1
1 -
 2
2 -
 3
3 -
 4
4 -
 5
5 -
 6
6 -
 7
7 -
 8
8 -
 9
9 -
 10
10 -
 11
11 -
 12
12 -
 13
13 -
 14
14 -
 15
15 -
 16
16 -
17
-
18
-
19
-
20
-
21
-
22
-
23
-
24
-
25
-
26
-
27
-
28
-
29
-
30
-
31
-
32
-
33
-
34
-
35
-
36
-
37
-
38
-
39
-
40
-
41
-
42
-
43
-
44
-
45
-
46
-
47
-
48
-
49
-
50
-
51
-
52
-
53
-
54
-
55
-
56
-
57
-
58
-
59
-
60
-
61
-
62
-
63
-
64
-
65
-
66
-
67
-
68
 |
 |
To Our Shareholders
I am grateful to our shareholders for the opportunity to present
the Company’s annual report for the fiscal year ended March 31,
2010.
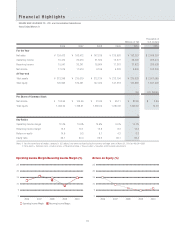
On a consolidated basis, net sales for the fiscal year ended
March 31, 2010 totaled ¥192,257 million (an increase of 41.7%
from the prior fiscal year), operating income amounted to
¥28,235 million (an increase of 130.0%), recurring income was
¥27,822 million (an increase of 147.1%) and net income
reached ¥9,509 million (an increase of 50.1%).
The Company’s operating income ratio was 14.7% and
return on equity (ROE) was 6.3%.
We set dividends applicable to the fiscal year ended March 31,
2010 at ¥35.00 per share. This amount includes a special
dividend of ¥5.00 yen per share to commemorate the achieve-
ment of record-high earnings and represents a consolidated
payout ratio of 42.3%.
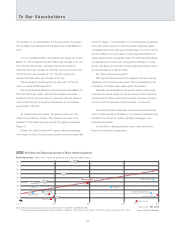
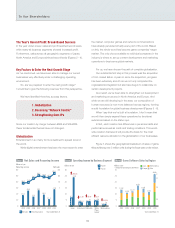
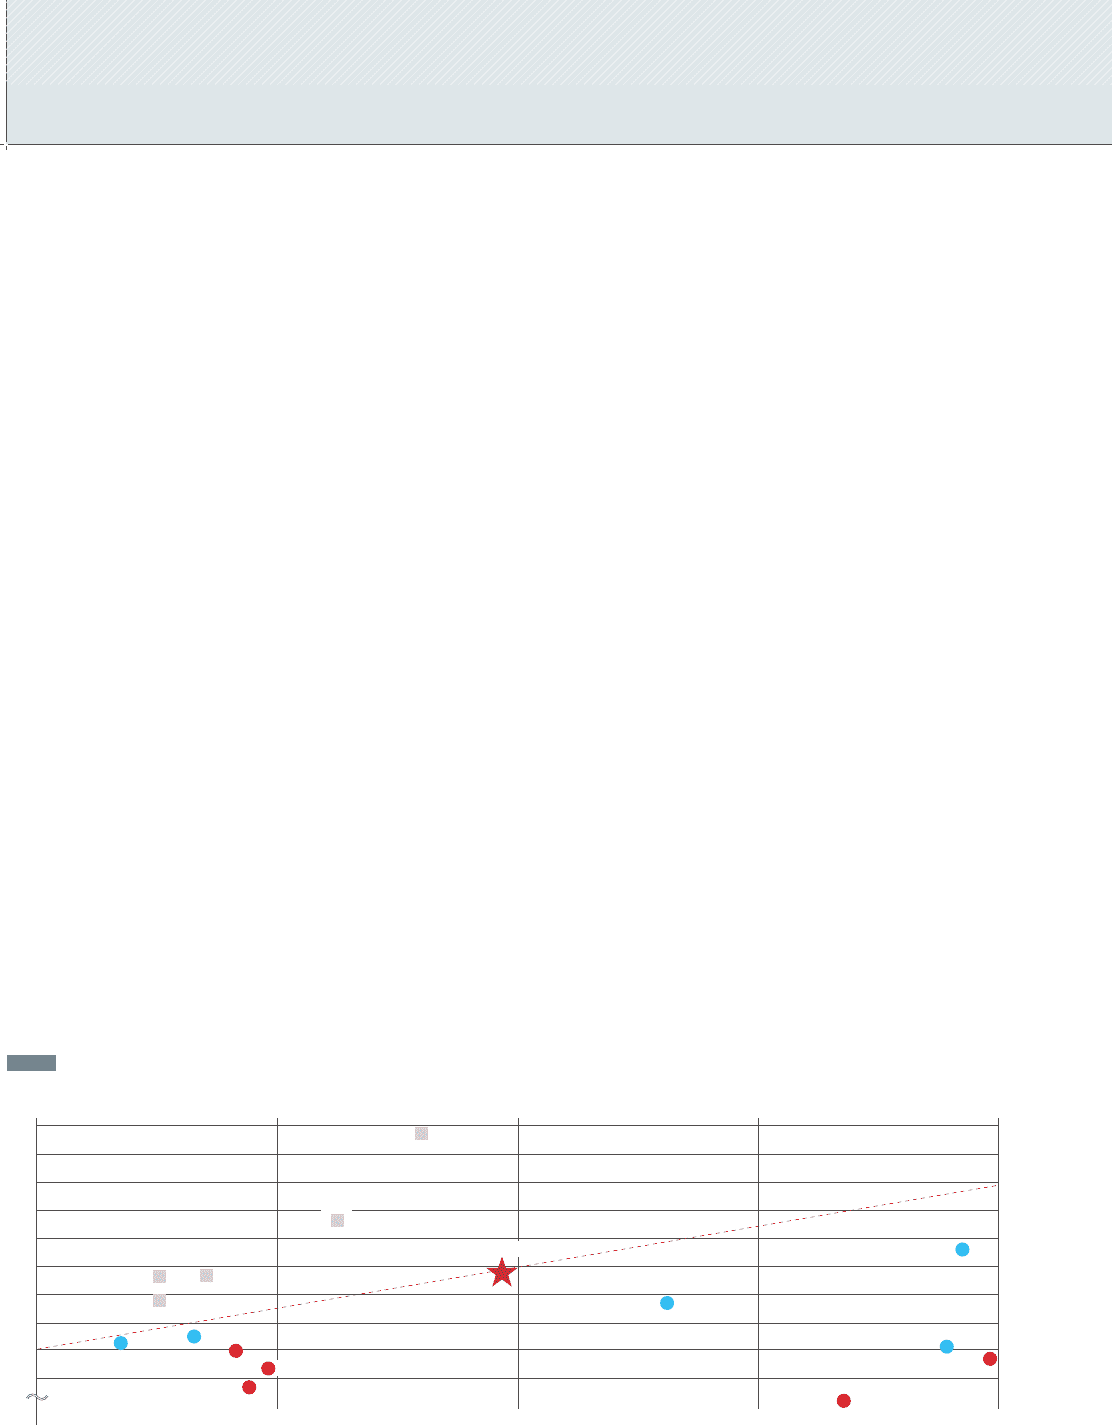
As I have mentioned before, the game industry is in the
midst of revolutionary change. This has become even more
apparent in the latest earnings reports from game companies
(Figure 1).
Despite the often touted shift in game industry leadership
from Japan to the U.S. and Europe, actual corporate results are
shown in Figure 1. Unfortunately, U.S. and European publishers
have seen profits wiped out and the largest Japanese game
companies have only narrowly avoided losses. It’s worth noting
that the difference is only based on business diversification at
Japan-based game companies while U.S. and European game
companies have focused on home gaming software. In other
words, this figure shows that the home gaming business alone
is unsustainable as it stands today.
So, what is the next key pillar?
Although we have achieved the highest profit ratio among
Japanese, U.S. and European peers, this is surpassed by the
profit ratios of certain major Asian game companies.
Naturally, the remarkable local growth rates in their home
countries as well as supportive government policies have been
positive factors. More importantly, however, I believe this trend
shows a shift to business models centered on networks.
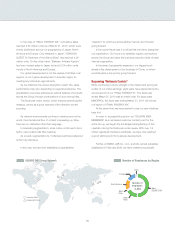
We face significant challenges as we must simultaneously
work to both maintain profitability in our current businesses and
transform our Group by quickly identifying changes in the
business ecosystem.
I would like to discuss the fiscal year under review from
these two important perspectives.
Recurring income
Billions of yen Net sales
80
70
60
50
40
30
20
10
0
-10
-70
Notes: (1) The currency exchange rates on May 19, 2010 were ¥92=US$1, ¥113=EUR€1, ¥0.08=KRW, ¥13=RMB.
(2) The data for Japanese companies and for EA, THQ and Ubisoft is as of March 31, 2010; Take-Two is as of October 31, 2009; and for the others is as of December 31, 2009. Sources: SQUARE ENIX, Bloomberg
Net Sales and Recurring Income of Major Game Companies
Figure 1
100 200 300 (-63.1) 400
Tencent
TECMO KOEI
CAPCOM
Take-Two
THQ
NHN
Shanda
NetEase
NCsoft KONAMI
Electronic Arts
Activision Blizzard
SEGA SAMMY
NAMCO BANDAI Games
SQUARE ENIX
Ubisoft
Billions of yen *Figures are operating income except Japan GAAP companies.
03