Square Enix 2010 Annual Report Download - page 32
Download and view the complete annual report
Please find page 32 of the 2010 Square Enix annual report below. You can navigate through the pages in the report by either clicking on the pages listed below, or by using the keyword search tool below to find specific information within the annual report.-
 1
1 -
2
-
3
-
4
-
5
-
6
-
7
-
8
-
9
-
10
-
11
-
12
-
13
-
14
-
15
-
16
-
17
-
18
-
19
-
20
-
21
-
 22
22 -
 23
23 -
 24
24 -
 25
25 -
 26
26 -
 27
27 -
 28
28 -
 29
29 -
 30
30 -
 31
31 -
 32
32 -
 33
33 -
 34
34 -
 35
35 -
 36
36 -
 37
37 -
 38
38 -
 39
39 -
 40
40 -
 41
41 -
 42
42 -
43
-
44
-
45
-
46
-
47
-
48
-
49
-
50
-
51
-
52
-
53
-
54
-
55
-
56
-
57
-
58
-
59
-
60
-
61
-
62
-
63
-
64
-
65
-
66
-
67
-
68
 |
 |

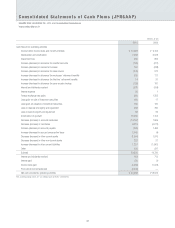
Consolidated Statements of Income (JPNGAAP)
SQUARE ENIX HOLDINGS CO., LTD. and Consolidated Subsidiaries
Years ended March 31
Millions of yen
2010 2009
Net sales ¥192,257 ¥135,693
Cost of sales *1 108,536 *1 79,527
Gross profi t 83,721 56,166
Reversal of allowance for sales returns 4,863 1,135
Provision for allowance for sales returns 4,046 1,598
Net gross profi t 84,538 55,703
Selling, general and administrative expenses
Packaging freight charge 3,535 2,169
Advertising expense 11,053 5,546
Sales promotion expense 157 417
Compensation for directors 519 456
Salaries 15,145 14,097
Provisions for reserve for bonuses 2,378 1,755
Net periodic pension costs 1,102 353
Provisions for reserve for directors’ retirement benefi ts 13 20
Welfare expense 1,755 1,799
Rental expense 2,367 2,375
Commissions paid 4,105 3,399
Depreciation and amortization 2,281 1,397
Other *2 11,886 *2 9,637
Total selling, general and administrative expenses 56,303 43,426
Operating income 28,235 12,277
Non-operating income
Interest income 188 696
Dividends received 343 12
Rental income 30 43
Miscellaneous income 195 157
Total non-operating income 758 909
Non-operating expenses
Interest expenses 30 1
Bond issuance cost 142 —
Investment loss on equity method 49 18
Foreign exchange loss 842 1,715
Miscellaneous loss 105 189
Total non-operating expenses 1,171 1,925
Recurring income 27,822 11,261
Extraordinary gain
Gain on sale of property and equipment *3 33 —
Gain on sale of investment securities 10 0
Reversal of allowance for doubtful accounts 913
Reversal of allowance for obligation related to legal proceedings — 181
Gain on forgiveness of debts 22 —
Gain on reversal of stock acquisition rights 20 —
Other 30 33
Total extraordinary gain 128 228
Extraordinary loss
Loss on sale of property and equipment *4 69 *4 26
Loss on disposal of property and equipment *5 389 *5 790
Loss on liquidation of subsidiaries and affi liates 72 —
Loss on evaluation of investment securities *6 166 *6 120
Impairment loss *7 255 *7 859
Accelerated amortization of goodwill *8 12,209 —
Severance payments associated with business restructuring 1,985 30
Provision for allowance for game arcade closings 25 286
Loss associated with business restructuring *9 1,860 —
Acquisition costs 770 —
Legal settlement payment —15
Other 114 221
Total extraordinary loss 17,919 2,350
Income before income taxes, minority interests and distribution of loss in partnership (tokumei-kumiai) 10,031 9,139
Distribution of loss (gain) in partnership (tokumei-kumiai) 4 (14)
Income before income taxes and minority interests 10,026 9,153
Current income taxes 1,881 4,502
Income taxes for prior periods *10 1,745 —
Refunded income taxes — (1,841)
Deferred income taxes (3,158) 198
Total income taxes 469 2,859
Minority interests in consolidated subsidiaries 48 (39)
Net income ¥ 9,509 ¥ 6,333
The accompanying notes are an integral part of these statements.
30