Square Enix 2010 Annual Report Download - page 10
Download and view the complete annual report
Please find page 10 of the 2010 Square Enix annual report below. You can navigate through the pages in the report by either clicking on the pages listed below, or by using the keyword search tool below to find specific information within the annual report.-
 1
1 -
 2
2 -
 3
3 -
 4
4 -
 5
5 -
 6
6 -
 7
7 -
 8
8 -
 9
9 -
 10
10 -
 11
11 -
 12
12 -
 13
13 -
 14
14 -
 15
15 -
 16
16 -
 17
17 -
 18
18 -
 19
19 -
 20
20 -
 21
21 -
22
-
23
-
24
-
25
-
26
-
27
-
28
-
29
-
30
-
31
-
32
-
33
-
34
-
35
-
36
-
37
-
38
-
39
-
40
-
41
-
42
-
43
-
44
-
45
-
46
-
47
-
48
-
49
-
50
-
51
-
52
-
53
-
54
-
55
-
56
-
57
-
58
-
59
-
60
-
61
-
62
-
63
-
64
-
65
-
66
-
67
-
68
 |
 |
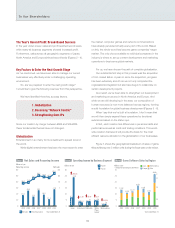
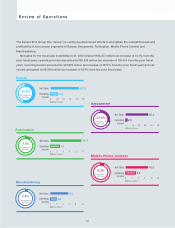
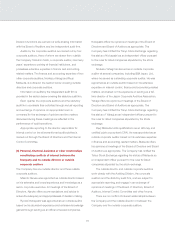
Games
Net Sales
Operating
Income 0 25 50 75 100 125
(Billions of yen)
109.9
23.8
57.2%
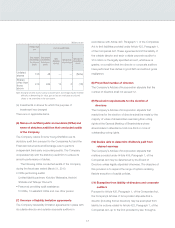
Amusement
Net Sales
Operating
Income 0 1530456075
(Billions of yen)
52.3
2.9
27.2%
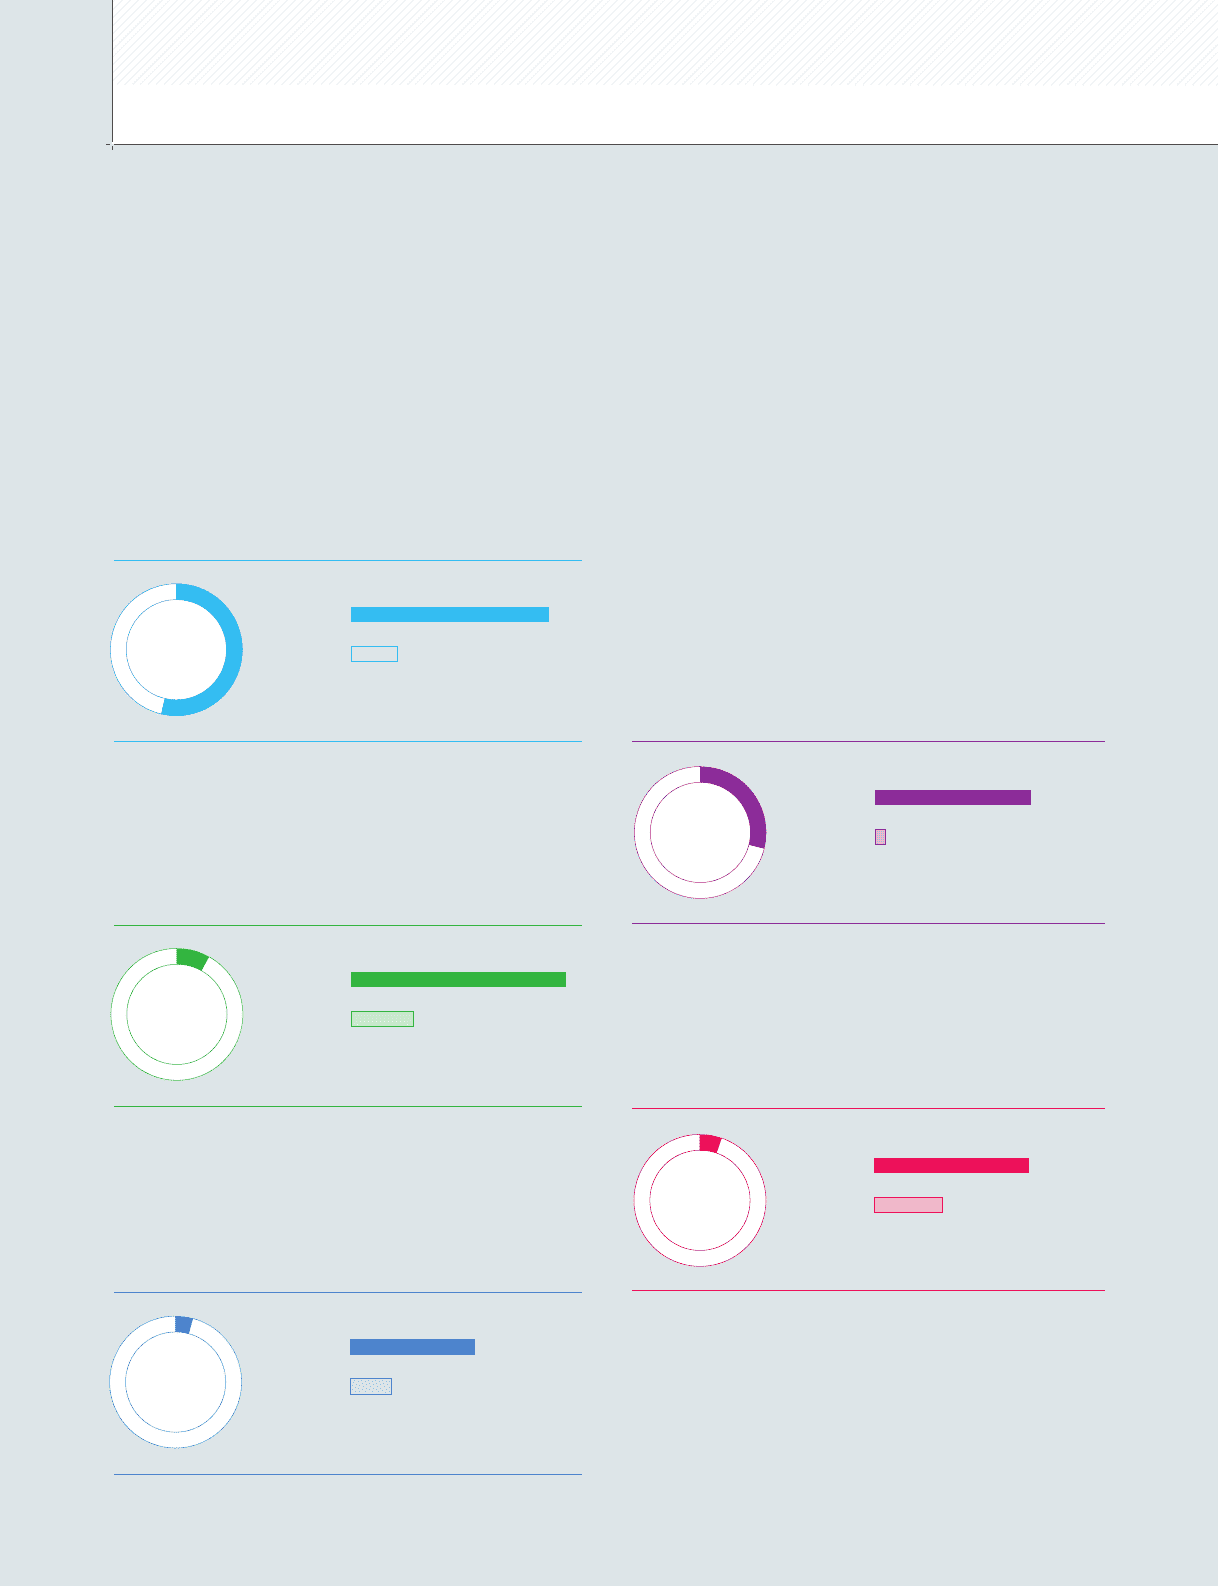
Publication
Net Sales
Operating
Income 03691215
(Billions of yen)
14.4
4.1
7.5%
Mobile Phone Content
Net Sales
Operating
Income 03691215
(Billions of yen)
10.2
4.6
5.3%
Merchandising
Net Sales
Operating
Income
0246810
(Billions of yen)
5.5
1.8
2.8%
Percentage of
Net Sales
Percentage of
Net Sales
Percentage of
Net Sales
Percentage of
Net Sales
Percentage of
Net Sales
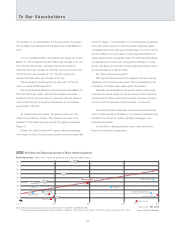
The Square Enix Group (the “Group”) is continuing determined efforts to strengthen the competitiveness and
profitability of its business segments of Games, Amusement, Publication, Mobile Phone Content and
Merchandising.
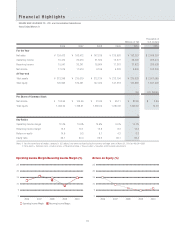
Net sales for the fiscal year ended March 31, 2010 totaled ¥192,257 million (an increase of 41.7% from the
prior fiscal year), operating income amounted to ¥28,235 million (an increase of 130.0% from the prior fiscal
year), recurring income amounted to ¥27,822 million (an increase of 147.1% from the prior fiscal year) and net
income amounted to ¥9,509 million (an increase of 50.1% from the prior fiscal year).
Review of Operations
08