SkyWest Airlines 2004 Annual Report Download - page 24
Download and view the complete annual report
Please find page 24 of the 2004 SkyWest Airlines annual report below. You can navigate through the pages in the report by either clicking on the pages listed below, or by using the keyword search tool below to find specific information within the annual report.-
 1
1 -
2
-
3
-
4
-
5
-
6
-
7
-
8
-
9
-
10
-
11
-
12
-
13
-
 14
14 -
 15
15 -
 16
16 -
 17
17 -
 18
18 -
 19
19 -
 20
20 -
 21
21 -
 22
22 -
 23
23 -
 24
24 -
 25
25 -
 26
26 -
 27
27 -
 28
28 -
 29
29 -
 30
30 -
 31
31 -
 32
32 -
 33
33 -
 34
34 -
35
-
36
-
37
-
38
-
39
-
40
-
41
-
42
-
43
-
44
-
45
-
46
-
47
-
48
-
49
-
50
-
51
-
52
-
53
-
54
-
55
-
56
-
57
-
58
-
59
-
60
-
61
-
62
-
63
-
64
-
65
-
66
-
67
-
68
 |
 |

22
policy the Company records maintenance expense on its CRJ200 engines as it is incurred. As a result, during the year ended
December 31, 2004 the Company collected and recorded as revenue $23.3 million (pretax) under the United Express Agreement,
with no corresponding offset for CRJ200 engine maintenance overhauls since none were incurred. Because the “Maintenance”
line in the table set forth above does not include salaries, wages and employee benefits associated with the Company’s
maintenance operations (those costs are stated separately in the table), the maintenance expense line in the above table differs
from the maintenance line in the Company’s Condensed Consolidated Statements of Income set forth in Item 8 below.
The cost per ASM for fuel increased to 3.3¢ for the year ended December 31, 2004, from 2.5¢ for the year ended December 31,
2003. This increase was primarily due to the average price of fuel increasing to $1.45 per gallon during the year ended December
31, 2004, from $1.12 per gallon for the year ended December 31, 2003.
The cost per ASM for other expenses, primarily consisting of landing fees, station rentals, computer reservation system fees and
hull and liability insurance, decreased 11.5% to 2.3¢ for the year ended December 31, 2004, from 2.6¢ for the year ended
December 31, 2003. The decrease was primarily related to the Company’s elimination of certain reservation and distribution costs
which were previously associated with the United Express Agreement that are now handled directly by United, along with the
increase in stage lengths flown by the Company’s regional jets.
Interest expense increased to approximately $18.2 million during the year ended December 31, 2004, from approximately $9.9
million during the year ended December 31, 2003. The increase in interest expense was primarily due to the long-debt financing
of the new regional jets acquired by the Company.
The Emergency War Time Supplemental Appropriations Act of 2003 became effective on May 15, 2003, and the Company
received approximately $6.5 million under the act. This legislation provides for compensation to domestic airlines based on their
proportional share of passenger security and infrastructure security fees paid, as well as reimbursement for installing fortified
flight deck doors. This legislation also provides for the suspension of passenger and infrastructure fees from June 1, 2003 through
October 31, 2003 and an extension of war risk liability and hull insurance coverage through December 31, 2004. Pursuant to the
Consolidated Appropriations Act of 2005, Congress further extended the government’s mandate to provide war-risk insurance
through August 31, 2005. The Company is unable to predict whether the government will extend this insurance coverage past
August 31, 2005. However, under terms of the Company’s contracts with its major partners, such insurance expense is a “pass-
through” cost and is not anticipated to have a material impact on the Company’s ongoing operations or future financial results.
2003 Compared to 2002
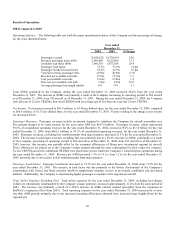
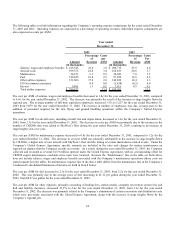
Operating Statistics. The following table sets forth the major operational statistics and the percentage-of-change for the years
ended identified below:
Year ended
December 31,
2003 2002 %Change
Passengers carried 10,738,691 8,388,935 28.0
Revenue passenger miles (000) 4,222,669 2,990,753 41.2
Available seat miles (000) 5,875,029 4,356,053 34.9
Passenger load factor 71.9% 68.7% 3.2 pts
Passenger breakeven load factor 63.9% 58.4% 5.5 pts
Yield per revenue passenger mile 20.90¢ 25.73¢ (18.8)
Revenue per available seat mile 15.10¢ 17.78¢ (15.1)
Cost per available seat mile 13.40¢ 15.12¢ (11.4)
Fuel cost per available seat mile 2.50¢ 2.20¢ 13.6
Average passenger trip length (miles) 393 356 10.4
Total ASMs generated by the Company during the year ended December 31, 2003 increased 34.9% from the year ended
December 31, 2002. The increase in ASMs was primarily a result of the Company increasing its operating aircraft to 185 aircraft
as of December 31, 2003, from 149 aircraft as of December 31, 2002. During the year ended December 31, 2003, the Company
took delivery of 39 additional CRJ200s.