SkyWest Airlines 2004 Annual Report Download - page 18
Download and view the complete annual report
Please find page 18 of the 2004 SkyWest Airlines annual report below. You can navigate through the pages in the report by either clicking on the pages listed below, or by using the keyword search tool below to find specific information within the annual report.-
 1
1 -
2
-
3
-
4
-
5
-
6
-
7
-
 8
8 -
 9
9 -
 10
10 -
 11
11 -
 12
12 -
 13
13 -
 14
14 -
 15
15 -
 16
16 -
 17
17 -
 18
18 -
 19
19 -
 20
20 -
 21
21 -
 22
22 -
 23
23 -
 24
24 -
 25
25 -
 26
26 -
 27
27 -
 28
28 -
29
-
30
-
31
-
32
-
33
-
34
-
35
-
36
-
37
-
38
-
39
-
40
-
41
-
42
-
43
-
44
-
45
-
46
-
47
-
48
-
49
-
50
-
51
-
52
-
53
-
54
-
55
-
56
-
57
-
58
-
59
-
60
-
61
-
62
-
63
-
64
-
65
-
66
-
67
-
68
 |
 |

16
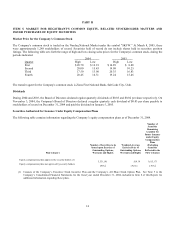
Year Ended December 31, 2003
First
Quarter
Second
Quarter
Third
Quarter
Fourth
Quarter Year
Operating revenues (000) $ 207,362 $ 212,694 $ 230,490 $ 237,480 $ 888,026
Operating income (000) 20,149 24,252 35,233 28,846 108,480
Net income (000) 13,300 14,896 21,128 17,463 66,787
Net income per common share:
Basic earnings per share $ 0.23 $ 0.26 $ 0.37 $ 0.30 $ 1.16
Diluted earnings per share 0.23 0.26 0.36 0.30 1.15
Weighted average common shares:
Basic: 57,641 57,648 57,837 57,853 57,745
Diluted: 57,649 57,974 58,423 58,397 58,127
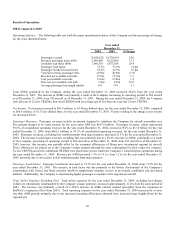
The following terms used in this section and elsewhere in this Report have the meanings indicated below:
"Revenue passenger miles" represents the number of miles flown by revenue passengers.
"Available seat miles" represents the number of seats available for passengers multiplied by the number of miles the seats are
flown.
"Load factor" represents the percentage of aircraft seating capacity that is actually utilized (revenue passenger miles divided by
available seat miles).
"Breakeven load factor" is the passenger load factor that will result in operating revenues being equal to operating expenses,
assuming constant revenue per passenger mile and expenses.
"Yield per passenger mile" represents the average amount one passenger pays to fly one mile.
"Passenger revenue per available seat mile" represents passenger revenue divided by available seat miles.
"Operating cost per available seat mile" represents operating expenses plus interest divided by available seat miles.