SkyWest Airlines 2004 Annual Report Download - page 17
Download and view the complete annual report
Please find page 17 of the 2004 SkyWest Airlines annual report below. You can navigate through the pages in the report by either clicking on the pages listed below, or by using the keyword search tool below to find specific information within the annual report.-
 1
1 -
2
-
3
-
4
-
5
-
6
-
 7
7 -
 8
8 -
 9
9 -
 10
10 -
 11
11 -
 12
12 -
 13
13 -
 14
14 -
 15
15 -
 16
16 -
 17
17 -
 18
18 -
 19
19 -
 20
20 -
 21
21 -
 22
22 -
 23
23 -
 24
24 -
 25
25 -
 26
26 -
 27
27 -
28
-
29
-
30
-
31
-
32
-
33
-
34
-
35
-
36
-
37
-
38
-
39
-
40
-
41
-
42
-
43
-
44
-
45
-
46
-
47
-
48
-
49
-
50
-
51
-
52
-
53
-
54
-
55
-
56
-
57
-
58
-
59
-
60
-
61
-
62
-
63
-
64
-
65
-
66
-
67
-
68
 |
 |

15
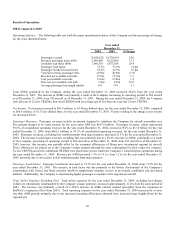
ITEM 6. SELECTED FINANCIAL AND OPERATING DATA
The following selected financial and operating data of the Company should be read in conjunction with “Management’s
Discussion and Analysis of Financial Condition and Results of Operations,” and the Company’s consolidated financial statements
and related notes included elsewhere in this Report.
Selected Consolidated Financial Data (amounts in thousands, except per share data):
Year Ended December 31,
2004 2003 2002 2001 2000
Operating revenues $ 1,156,044 $ 888,026 $ 774,447 $ 601,865 $ 522,997
Operating income 144,776 108,480 119,555 65,564 89,047
Income before cumulative effect of change
in accounting principle 81,952 66,787 78,277 50,516 60,874
Net income 81,952 66,787 86,866 50,516 60,874
Net income per common share:
Basic $ 1.42 $ 1.16 $ 1.52 $ 0.90 $ 1.18
Diluted 1.40 1.15 1.51 0.88 1.16
Weighted average shares:
Basic 57,858 57,745 57,229 56,365 51,521
Diluted 58,350 58,127 57,551 57,237 52,644
Total assets $ 1,662,287 $ 1,529,210 $ 999,384 $ 831,566 $ 676,412
Current assets 712,337 670,368 513,233 386,556 361,602
Current liabilities 175,831 151,959 121,388 115,738 81,935
Long-term debt, net of
current maturities 463,233 462,773 125,379 113,688 75,751
Stockholders’ equity 779,055 709,063 638,686 545,840 484,953
Return on average equity(1) 11.0% 9.9% 14.7% 9.8% 16.1%
(1) Calculated by dividing net income by the average of beginning and ending stockholders’ equity for the year
Selected Operating Data
Year Ended December 31,
2004 2003 2002 2001 2000
Block hours 589,129 482,158 405,007 356,370 344,694
Departures 464,697 395,631 351,631 333,383 332,509
Passengers carried 13,424,520 10,738,691 8,388,935 6,229,867 5,598,499
Revenue passenger miles (000) 5,546,069 4,222,669 2,990,753 1,732,180 1,277,001
Available seat miles (000) 7,546,318 5,875,029 4,356,053 2,837,278 2,256,635
Load factor 73.5% 71.9% 68.7% 61.1% 56.6%
Break-even load factor 65.5% 63.9% 58.4% 54.4% 47.2%
Yield per revenue passenger mile 20.50¢ 20.90¢ 25.73¢ 34.41¢ 40.42¢
Revenue per available seat mile 15.30¢ 15.10¢ 17.78¢ 21.21¢ 23.18¢
Cost per available seat mile 13.60¢ 13.40¢ 15.12¢ 18.90¢ 19.23¢
Average passenger trip length 413 393 356 278 228
Number of operating aircraft at end of year 206 185 149 131 107
Quarterly Financial Data
Year Ended December 31, 2004
First
Quarter
Second
Quarter
Third
Quarter
Fourth
Quarter Year
Operating revenues (000) $ 253,704 $ 267,387 $ 308,265 $ 326,688 $ 1,156,044
Operating income (000) 34,857 35,159 37,942 36,818 144,776
Net income (000) 19,370 20,054 21,279 21,249 81,952
Net income per common share:
Basic $ 0.33 $ 0.35 $ 0.37 $ 0.37 $ 1.42
Diluted 0.33 0.34 0.37 0.37 1.40