SkyWest Airlines 2004 Annual Report Download - page 22
Download and view the complete annual report
Please find page 22 of the 2004 SkyWest Airlines annual report below. You can navigate through the pages in the report by either clicking on the pages listed below, or by using the keyword search tool below to find specific information within the annual report.-
 1
1 -
2
-
3
-
4
-
5
-
6
-
7
-
8
-
9
-
10
-
11
-
 12
12 -
 13
13 -
 14
14 -
 15
15 -
 16
16 -
 17
17 -
 18
18 -
 19
19 -
 20
20 -
 21
21 -
 22
22 -
 23
23 -
 24
24 -
 25
25 -
 26
26 -
 27
27 -
 28
28 -
 29
29 -
 30
30 -
 31
31 -
 32
32 -
33
-
34
-
35
-
36
-
37
-
38
-
39
-
40
-
41
-
42
-
43
-
44
-
45
-
46
-
47
-
48
-
49
-
50
-
51
-
52
-
53
-
54
-
55
-
56
-
57
-
58
-
59
-
60
-
61
-
62
-
63
-
64
-
65
-
66
-
67
-
68
 |
 |

20
Results of Operations
2004 Compared to 2003
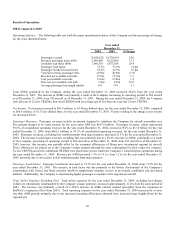
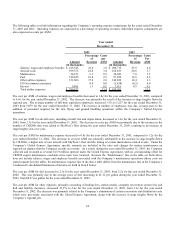
Operating Statistics. The following table sets forth the major operational statistics of the Company and the percentage-of-change
for the years identified below.
Year ended
December 31,
2004 2003 %Change
Passengers carried 13,424,520 10,738,691 25.0
Revenue passenger miles (000) 5,546,069 4,222,669 31.3
Available seat miles (000) 7,546,318 5,875,029 28.4
Passenger load factor 73.5% 71.9% 1.6 pts
Passenger breakeven load factor 65.5% 63.9% 1.6 pts
Yield per revenue passenger mile 20.50¢ 20.90¢ (1.9)
Revenue per available seat mile 15.30¢ 15.10¢ 1.3
Cost per available seat mile 13.60¢ 13.40¢ 1.5
Fuel cost per available seat mile 3.30¢ 2.50¢ 32.0
Average passenger trip length (miles) 413 393 5.1
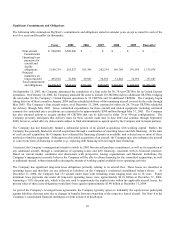
Total ASMs generated by the Company during the year ended December 31, 2004 increased 28.4% from the year ended
December 31, 2003. The increase in ASMs was primarily a result of the Company increasing its operating aircraft to 206 aircraft
as of December 31, 2004, from 185 aircraft as of December 31, 2003. During the year ended December 31, 2004, the Company
took delivery of 12 new CRJ200s, four used CRJ200s with an average age of less than one year and 12 new CRJ700s.
Net Income. Net income increased to $81.9 million, or $1.40 per diluted share, for the year ended December 31, 2004, compared
to $66.8 million, or $1.15 per diluted share, for the year ended December 31, 2003. Factors relating to the change in net income
are discussed below.
Passenger Revenues. Passenger revenues include an amount designed to reimburse the Company for aircraft ownership cost.
The amount deemed to be rental income for the year ended 2004 was $187.0 million. Passenger revenues, which represented
98.6% of consolidated operating revenues for the year ended December 31, 2004, increased 29.2% to $1.14 billion for the year
ended December 31, 2004, from $882.1 million, or 99.3% of consolidated operating revenues, for the year ended December 31,
2003. Passenger revenues, excluding fuel reimbursements from major partners, increased 21.1% for the year ended December 31,
2004. The increase in passenger revenues excluding fuel was primarily due to a 28.4% increase in ASMs, principally as a result
of the Company increasing its operating aircraft to 206 aircraft as of December 31, 2004, from 185 aircraft as of December 31,
2003; however, this increase was partially offset by the economic efficiencies of flying new, incremental regional jet aircraft.
These efficiencies are passed on to the Company’s major partners through the rates contemplated by their respective contracts.
Twelve CRJ700s and twelve additional CRJ200s were placed into service under the Company’s United Express operations during
the year ended December 31, 2004. Revenue per ASM increased 1.3% to 15.3¢, from 15.1¢ for the year ended December 31,
2003, primarily due to an increase in fuel reimbursements from major partners.
Passenger Load Factor. Passenger load factor increased to 73.5% for the year ended December 31, 2004, from 71.9% for the
year ended December 31, 2003. The increase in load factor was due primarily to the further development of the Company’s
relationships with United and Delta whereby SkyWest supplements mainline service in previously established and developed
markets. Additionally, the Company is experiencing higher passenger acceptance of its regional jet aircraft.
Total Airline Expenses Excluding Fuel. Total airline expenses for the year ended December 31, 2004, excluding fuel charges
(which are substantially reimbursable by the Company’s major partners), increased approximately 21.4% from the same period of
2003. The increase was primarily a result of a 28.4% increase in ASMs (which resulted principally from the expansion of
SkyWest’s regional jet fleet from 2003). Total operating expenses for the year ended December 31, 2004 increased at a lower
rate than ASM growth, primarily due to the increased operating efficiencies obtained from increased stage lengths flown by the
regional jets.