Shutterfly 2008 Annual Report Download - page 40
Download and view the complete annual report
Please find page 40 of the 2008 Shutterfly annual report below. You can navigate through the pages in the report by either clicking on the pages listed below, or by using the keyword search tool below to find specific information within the annual report.-
 1
1 -
2
-
3
-
4
-
5
-
6
-
7
-
8
-
9
-
10
-
11
-
12
-
13
-
14
-
15
-
16
-
17
-
18
-
19
-
20
-
21
-
22
-
23
-
24
-
25
-
26
-
27
-
28
-
29
-
 30
30 -
 31
31 -
 32
32 -
 33
33 -
 34
34 -
 35
35 -
 36
36 -
 37
37 -
 38
38 -
 39
39 -
 40
40 -
 41
41 -
 42
42 -
 43
43 -
 44
44 -
 45
45 -
 46
46 -
 47
47 -
 48
48 -
 49
49 -
 50
50 -
51
-
52
-
53
-
54
-
55
-
56
-
57
-
58
-
59
-
60
-
61
-
62
-
63
-
64
-
65
-
66
-
67
-
68
-
69
-
70
-
71
-
72
-
73
-
74
-
75
-
76
-
77
-
78
-
79
-
80
-
81
-
82
-
83
-
84
-
85
-
86
-
87
-
88
-
89
-
90
-
91
-
92
-
93
-
94
-
95
-
96
-
97
-
98
-
99
-
100
-
101
-
102
-
103
-
104
-
105
-
106
-
107
-
108
-
109
-
110
-
111
-
112
-
113
-
114
-
115
-
116
-
117
-
118
-
119
-
120
-
121
-
122
-
123
-
124
-
125
-
126
-
127
-
128
-
129
-
130
-
131
-
132
 |
 |

Our industry is competitive and has endured periods of intense price competition. Because we plan to finance our operations and capital expenses largely through our operations,
and because our results of operations are sensitive to the level of competition we face, increased competition could adversely affect our liquidity and capital resources. Increased
competition could do so both by reducing our net revenues and net income, as a result of reduced sales, reduced prices and increased promotional activities, among other factors, as
well as by requiring us to spend cash on advertising and marketing in an effort to maintain or increase market share in the face of such competition. In addition, we intend to increase
many of our expenses, including some capital expenses, in advance of anticipated higher future revenues. However, such increased expenses, while intended to support anticipated
increases in future revenues, must be funded from current capital resources or from borrowings or equity financings. As a result, our ability to grow our business relying largely on
funds from our operations is sensitive to competitive pressures and other risks relating to our liquidity or capital resources.
We anticipate capital expenditures of between $43 million to $47 million for 2008. These expenditures will be used to purchase machinery and equipment to support the growth in
our business and to increase our production capacity and help enable us to respond more quickly and efficiently to customer demand. This range of capital expenditures, while
significant, is not outside the ordinary course of our business or materially different from how we have expanded our business in the past. We believe that such capital expenditures will
have a positive effect on our results of operations if demand increases in line with increases in our production capacity. However, these capital expenditures will have a negative effect
on our results of operations if demand does not increase as we expect, and will have a negative effect on our results of operations in the short term if demand does not increase
simultaneously, as we expect, with the capital expenditures spent to support increased demand.
Operating Activities.
For 2007, net cash provided by operating activities was $42.2 million, primarily due to our net income of $10.1 million and the net change in operating
assets and liabilities of $4.2 million, adjusted for non-
cash items including $17.8 million of depreciation and amortization expense, $5.9 million of provision for deferred income taxes,
and $4.0 million of stock-based compensation.
For 2006, net cash provided by operating activities was $23.5 million, primarily due to our net income of $5.8 million and the net change in operating assets and liabilities of
$0.7 million, adjusted for non-cash items including $10.7 million of depreciation and amortization expense, $3.2 million of provision for income taxes, $2.3 million of stock-
based
compensation and $0.9 million for charitable contribution expense related to our September 2006 donation of 65,000 shares to Silicon Valley Community Foundation. We do not
expect to make additional donations to Silicon Valley Community Foundation in the foreseeable future.
In 2005, net cash provided from operating activities of $18.6 million resulted from net income of $28.9 million that was adjusted for $6.2 million of depreciation and amortization,
$23.8 million of income tax benefit and $3.3 million of non-cash amortization of stock-
based compensation. In addition, net cash from operating activities increased due to a
$4.1 million increase in accounts payable and accrued liabilities due to seasonally high balances at December 31, 2005 related to increased purchasing for the fourth quarter holiday
season. Accounts payable and accrued liability balances were higher as of December 31, 2005 compared to as of December 31, 2004 due to higher sales in the 2005 fourth quarter
holiday season.
Investing Activities.
For 2007, net cash used in investing activities included $35.0 million for capital expenditures for computer and network hardware for our website
infrastructure and information technology systems, capital expenditures for production equipment for our manufacturing and production operations at our California and North Carolina
facilities, and capitalized website development costs related to projects that were placed into service. Additional cash of $3.0 million and $2.9 million was used for purchases of short-
term investments and acquisition of “Make-it-About-Me,” respectively.
For 2006, cash used in investing activities was $20.7 million for capital expenditures for computer and network hardware to support our website infrastructure and information
technology computer hardware, capital expenditures for production equipment for our manufacturing and production operations at our Hayward, California facilities, and capitalized
website development costs related to projects that were placed into service.
For 2005, net cash used in investing activities was $10.6 million for capital expenditures for computer and network hardware to support our website infrastructure and information
technology computer hardware, capital expenditures for production equipment for our manufacturing and production operations at our Hayward, California facilities, and capitalized
website development costs related to projects that were placed into service.
Financing Activities.
Our financing activities for 2007 provided cash of $2.1 million, primarily from $5.0 million of proceeds from issuance of common stock, offset by
$2.8 million of capitalized lease obligations.
Our financing activities for 2006 provided cash of $77.1 million, primarily from $78.5 million of IPO proceeds, net of underwriters’
fees and offering costs, offset by $1.4 million
of capitalized lease obligations.
For 2005, we generated cash of $17.4 million, primarily the result of receiving net proceeds of $19.8 million from the sale of our Series F preferred stock in November 2005. This
increase in cash was offset by $2.4 million in principal payments on capital lease obligations.
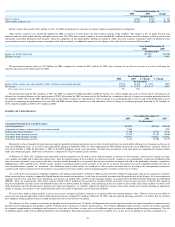
Contractual Obligations
We lease office space in Redwood City, California and production facilities in Hayward, California under various non-
cancelable operating leases that expire between 2009 and
2010. In 2006, we entered into a non-
cancelable operating lease for our new production facility in Charlotte, North Carolina. The lease commenced in May, 2007, and will expire in
2014. We also lease website infrastructure computer and network hardware, production equipment, information technology equipment and software under various capital leases that
expire through the year 2011. We also have a co-location agreement with a third-
party hosting facility that expires in 2009. As a result of our growth strategies, we believe that our
liquidity and capital resources requirements will grow in absolute dollars but will be generally consistent with historical periods on an annual basis as a percentage of net revenues. We
anticipate leasing additional office space, production facilities and hosting facilities in future periods, consistent with our historical business model.
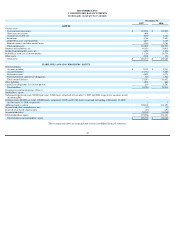
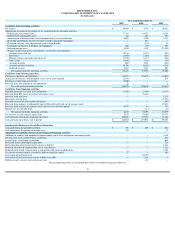
The following are contractual commitments at December 31, 2007, associated with lease obligations and other arrangements:
__________
Other than the obligations, liabilities and commitments described above, we have no significant unconditional purchase obligations or similar instruments. We are not a guarantor
of any other entities’ debt or other financial obligations.
Off-Balance Sheet Arrangements
We do not have any relationships with unconsolidated entities or financial partnerships, such as entities often referred to as structured finance or special purpose entities, which
would have been established for the purpose of facilitating off-
balance sheet arrangements or other contractually narrow or limited purposes. In addition, we do not have any
undisclosed borrowings or debt, and we have not entered into any synthetic leases. We are, therefore, not materially exposed to any financing, liquidity, market or credit risk that could
arise if we had engaged in such relationships. In December, 2007, we had signed a definitive agreement to acquire Nexo Systems (
“
Nexo
”
)
for total cash proceeds of $10.0 million and
Total
Less Than
1 Year
1
-
3 Years
3
-
5 Years
More Than
5 Years
(In thousands)
Contractual Obligations
Capital lease obligations
$ 975
$864
$111
$
—
$
—
Operating lease obligations
9,391
2,548
4,766
2,077
—
Purchase obligations
(1)
2,821
2,620
201
—
—
Total contractual obligations
$
13,187
$
6,032
$
5,078
$
2,077
$___
---
(1)
Purchase obligations include commitments under non
-
cancelable marketing agreements, license agreements, and third
-
party hosting services.