Shutterfly 2008 Annual Report Download - page 34
Download and view the complete annual report
Please find page 34 of the 2008 Shutterfly annual report below. You can navigate through the pages in the report by either clicking on the pages listed below, or by using the keyword search tool below to find specific information within the annual report.-
 1
1 -
2
-
3
-
4
-
5
-
6
-
7
-
8
-
9
-
10
-
11
-
12
-
13
-
14
-
15
-
16
-
17
-
18
-
19
-
20
-
21
-
22
-
23
-
 24
24 -
 25
25 -
 26
26 -
 27
27 -
 28
28 -
 29
29 -
 30
30 -
 31
31 -
 32
32 -
 33
33 -
 34
34 -
 35
35 -
 36
36 -
 37
37 -
 38
38 -
 39
39 -
 40
40 -
 41
41 -
 42
42 -
 43
43 -
 44
44 -
45
-
46
-
47
-
48
-
49
-
50
-
51
-
52
-
53
-
54
-
55
-
56
-
57
-
58
-
59
-
60
-
61
-
62
-
63
-
64
-
65
-
66
-
67
-
68
-
69
-
70
-
71
-
72
-
73
-
74
-
75
-
76
-
77
-
78
-
79
-
80
-
81
-
82
-
83
-
84
-
85
-
86
-
87
-
88
-
89
-
90
-
91
-
92
-
93
-
94
-
95
-
96
-
97
-
98
-
99
-
100
-
101
-
102
-
103
-
104
-
105
-
106
-
107
-
108
-
109
-
110
-
111
-
112
-
113
-
114
-
115
-
116
-
117
-
118
-
119
-
120
-
121
-
122
-
123
-
124
-
125
-
126
-
127
-
128
-
129
-
130
-
131
-
132
 |
 |

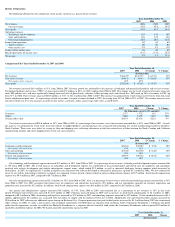
Results of Operations
The following table presents the components of our income statement as a percent of net revenues:
Comparison of the Years Ended December 31, 2007 and 2006
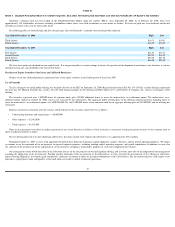
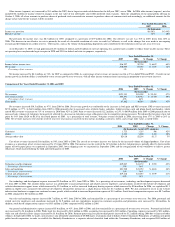
Net revenues increased $63.4 million, or 51%, from 2006 to 2007. Revenue growth was attributable to the increases in both print and personalized products and services revenues.
Personalized products and services (“PPS”)
revenues increased $42.9 million, or 69%, to $105.3 million from 2006 to 2007. This change was the result of increased revenue across our
entire PPS product base, and most significantly through increased sales of photo books, calendars, folded greeting cards, and referral fees. PPS made up 56% of revenues in 2007, up
from 51% in 2006. Print revenues increased $20.5 million, or 34%, to $81.4 million from 2006 to 2007. This increase was primarily the result of increased revenues from 4x6, large
format and photocard print sizes. As a percentage of total net revenue, 4x6 print revenues declined in 2007, decreasing from 28% in 2006 to 22% in 2007. Net revenue increases were
also the result of year-over-year increases in all of our key metrics: customers, orders, and average order value, as noted below:
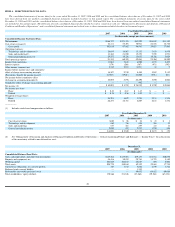
Cost of net revenues increased $28.6 million, or 52%, from 2006 to 2007. As a percentage of net revenues, cost of net revenues remained flat, at 45%, from 2006 to 2007. Overall,
this increase was primarily the result of the increased volume of shipped products, and incremental costs associated with launching our second manufacturing facility in Charlotte,
North Carolina. These costs were offset by savings in labor and shipping costs, reflecting efficiencies in both the reduced cost of labor between the North Carolina and California
manufacturing facilities and closer shipping routes to our east coast customers.
Our technology and development expense increased $9.5 million, or 50%, from 2006 to 2007. As a percentage of net revenues, technology and development expense remained flat
at 15% from 2006 to 2007. The overall increase in technology and development expense was attributable to increased personnel and related costs for employees and consultants
involved with website development and website infrastructure support teams, which totaled $3.2 million, as well as increased third-
party hosting expenses which increased by
$0.8 million. In 2007, we capitalized $3.1 million in eligible costs associated with software developed or obtained for internal use, up from $1.3 million in 2006. We also continued to
invest in our website infrastructure hardware to support our continued revenue growth, which resulted in increased depreciation expense of $3.7 million. Stock-
based compensation
expense was $0.9 million in 2007, compared to $0.7 million in 2006.
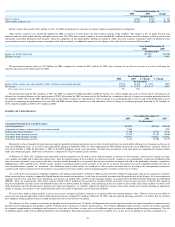
Our sales and marketing expense increased $11.4 million, or 52%, from 2006 to 2007. Also as a percentage of net revenues, total sales and marketing expense remained flat at 18%
from 2006 to 2007. For 2007, personnel and related costs for employees and consultants increased by $2.5 million, and our expenditures incurred on customer acquisition and
promotion costs increased by $8.2 million. In addition, stock-based compensation expense was $0.9 million in 2007, compared to $0.5 million in 2006.
Our general and administrative expense increased $10.3 million, or 54%, from 2006 to 2007, and remained flat as a percentage of net revenues at 16% in that same
period. Personnel and related costs increased by $3.3 million in 2007 reflecting increased hiring in 2007 and an increase in stock-
based compensation to $2.1 million, in 2007,
compared to $0.9 million in 2006. Accounting and legal fees increased by $1.2 million in 2007, and consulting expenses increased by $2.2 million. Of that combined increase of $3.4
million, approximately $2.2 million was associated with our efforts to comply with the Sarbanes-
Oxley Act of 2002. Additionally, rent and related facilities charges increased by
$0.8 million for 2007 reflecting our additional square footage in Redwood City. Payment processing fees paid to third parties increased by $1.5 million during 2007 due to increased
order volumes. In 2006, we made a non-recourse, non-refundable contribution of 65,000 shares of common stock to Silicon Valley Community Foundation, a California non-
profit
public benefit corporation, in order to establish the Shutterfly Foundation as a corporate-
advised charitable fund within the Community Foundation, and recognized $0.9 million of
charitable contribution expense for 2006. We had no charitable contribution expense in 2007.
Year Ended December 31,
2007
2006
2005
Net revenues
100%
100%
100%
Cost of revenues
45
%
45
%
44
%
Gross profit
55
%
55
%
56
%
Operating expenses:
Technology and development
15%
15%
16%
Sales and marketing
18%
18%
18%
General and administrative
16
%
16
%
16
%
Income from operations
6%
6%
6%
Interest expense
0%
0%
0%
Other income, net
2
%
2
%
0
%
Income before income taxes
8%
8%
6%
Benefit (provision) for income taxes
(3
)%
(3
)%
29
%
Net income
5
%
5
%
35
%
Year Ended December 31,
2007
2006
$ Change
% Change
(In thousands)
Net revenues
$186,727
$ 123,353
$ 63,374
51%
Cost of net revenues
$84,111
$ 55,491
$ 28,620
52%
Percentage of net revenues
45%
45%
-
-
Gross profit
$102,616
$ 67,862
$ 34,754
51%
Year Ended December 31,
2007
2006
Change
% Change
(In thousands, except AOV amounts)
Customers
2,357
1,725
632
37%
Orders
7,062
5,105
1,957
38%
Average order value
$26.44
$24.16
$2.28
9%
Year Ended December 31,
2007
2006
$ Change
% Change
(In thousands)
Technology and development
$28,635
$19,087
$ 9,548
50%
Percentage of net revenues
15%
15%
-
-
Sales and marketing
$33,363
$21,940
$ 11,423
52%
Percentage of net revenues
18%
18%
-
-
General and administrative
$29,557
$19,216
$ 10,341
54%
Percentage of net revenues
16%
16%
-
-
Year Ended December 31,
2007
2006
Change
(In thousands)