Shutterfly 2008 Annual Report Download - page 29
Download and view the complete annual report
Please find page 29 of the 2008 Shutterfly annual report below. You can navigate through the pages in the report by either clicking on the pages listed below, or by using the keyword search tool below to find specific information within the annual report.-
 1
1 -
2
-
3
-
4
-
5
-
6
-
7
-
8
-
9
-
10
-
11
-
12
-
13
-
14
-
15
-
16
-
17
-
18
-
 19
19 -
 20
20 -
 21
21 -
 22
22 -
 23
23 -
 24
24 -
 25
25 -
 26
26 -
 27
27 -
 28
28 -
 29
29 -
 30
30 -
 31
31 -
 32
32 -
 33
33 -
 34
34 -
 35
35 -
 36
36 -
 37
37 -
 38
38 -
 39
39 -
40
-
41
-
42
-
43
-
44
-
45
-
46
-
47
-
48
-
49
-
50
-
51
-
52
-
53
-
54
-
55
-
56
-
57
-
58
-
59
-
60
-
61
-
62
-
63
-
64
-
65
-
66
-
67
-
68
-
69
-
70
-
71
-
72
-
73
-
74
-
75
-
76
-
77
-
78
-
79
-
80
-
81
-
82
-
83
-
84
-
85
-
86
-
87
-
88
-
89
-
90
-
91
-
92
-
93
-
94
-
95
-
96
-
97
-
98
-
99
-
100
-
101
-
102
-
103
-
104
-
105
-
106
-
107
-
108
-
109
-
110
-
111
-
112
-
113
-
114
-
115
-
116
-
117
-
118
-
119
-
120
-
121
-
122
-
123
-
124
-
125
-
126
-
127
-
128
-
129
-
130
-
131
-
132
 |
 |
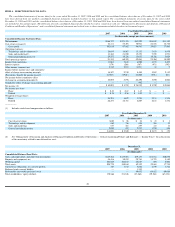
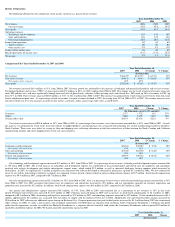
ITEM 6. SELECTED FINANCIAL DATA.
The consolidated statements of income data for the years ended December 31, 2007, 2006 and 2005 and the consolidated balance sheet data as of December 31,
2007 and 2006
have been derived from our audited consolidated financial statements included elsewhere in this annual report. The consolidated statements of income
data for the years ended
December 31, 2004 and 2003 and the consolidated balance
sheet data as of December 31, 2005, 2004 and 2003 have been derived from our
audited consolidated financial statements
not included in this annual report. The following selected consolidated financial data should be read in conjunction with our “Management’
s Discussion and Analysis of Financial
Condition and Results of Operations” and consolidated financial statements and related notes to those statements included elsewhere in this annual report.
__________
Year Ended December 31,
2007
2006
2005
2004
2003
(In thousands, except per share amounts)
Consolidated Income Statement Data:
Net revenues
$186,727
$123,353
$83,902
$54,499
$31,395
Cost of net revenues(1)
84,111
55,491
36,941
24,878
14,310
Gross profit
102,616
67,862
46,961
29,621
17,085
Operating expenses:
Technology and development(1)
28,635
19,087
13,152
7,433
4,970
Sales and marketing(1)
33,363
21,940
15,252
7,705
3,991
General and administrative(1)
29,557
19,216
13,657
10,126
5,629
Total operating expense
91,555
60,243
42,061
25,264
14,590
Income from operations
11,061
7,619
4,900
4,357
2,495
Interest expense
(179)
(266)
(367)
(471)
(392)
Other income (expense) net
5,515
2,387
(103
)
81
9
Income before income taxes and cumulative
effect of change in accounting principle
16,397
9,740
4,430
3,967
2,112
(Provision) / benefit for income taxes(2)
(6,302
)
(3,942
)
24,060
(258
)
(68
)
Net income before cumulative effect
of change in accounting principle(2)
10,095
5,798
28,490
3,709
2,044
Cumulative effect of change in accounting principle
—
—
442
—
—
Net income (2)
$
10,095
$
5,798
$
28,932
$
3,709
$
2,044
Net income per share:
Basic
$ 0.42
$ 0.67
$ 1.45
$
—
$
—
Diluted
$ 0.38
$ 0.56
$ 1.02
$
—
$
—
Weighted Average Shares
Basic
24,295
8,622
3,255
2,231
1,574
Diluted
26,273
10,331
4,609
2,231
1,574
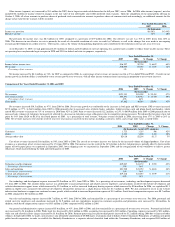
(1)
Includes stock
-
based compensation as follows:
Year Ended December 31,
2007
2006
2005
2004
2003
(In thousands)
Cost of net revenues
$189
$ 96
$ 28
$ 21
$ 3
Technology and development
880
736
826
263
32
Sales and marketing
877
521
239
117
11
General and administration
2,055
947
2,217
1,790
124
$
4,001
$
2,300
$
3,310
$
2,191
$
170
(2)
See “Management’s Discussion and Analysis of Financial Condition and Results of Operations — Critical Accounting Policies and Estimates — Income Taxes”
for a discussion
of the uncertainty related to our deferred tax asset.
December 31,
2007
2006
2005
2004
2003
(In thousands)
Consolidated Balance Sheet Data:
Cash, cash equivalents, and short term investments
$125,584
$119,051
$39,153
$13,781
$10,670
Property and equipment, net
48,416
30,919
20,761
11,723
5,140
Working capital
104,025
102,165
22,687
690
2,002
Total assets
208,770
180,160
89,552
29,865
17,754
Capital lease obligations, less current portion
107
1,742
3,646
2,709
1,314
Preferred stock warrant liability
—
—
1,535
—
—
Redeemable convertible preferred stock
—
—
89,652
69,822
69,668
Total stockholders
’
equity (deficit)
170,566
151,326
(27,262)
(59,568)
(65,333)
20