Shutterfly 2008 Annual Report Download - page 38
Download and view the complete annual report
Please find page 38 of the 2008 Shutterfly annual report below. You can navigate through the pages in the report by either clicking on the pages listed below, or by using the keyword search tool below to find specific information within the annual report.-
 1
1 -
2
-
3
-
4
-
5
-
6
-
7
-
8
-
9
-
10
-
11
-
12
-
13
-
14
-
15
-
16
-
17
-
18
-
19
-
20
-
21
-
22
-
23
-
24
-
25
-
26
-
27
-
 28
28 -
 29
29 -
 30
30 -
 31
31 -
 32
32 -
 33
33 -
 34
34 -
 35
35 -
 36
36 -
 37
37 -
 38
38 -
 39
39 -
 40
40 -
 41
41 -
 42
42 -
 43
43 -
 44
44 -
 45
45 -
 46
46 -
 47
47 -
 48
48 -
49
-
50
-
51
-
52
-
53
-
54
-
55
-
56
-
57
-
58
-
59
-
60
-
61
-
62
-
63
-
64
-
65
-
66
-
67
-
68
-
69
-
70
-
71
-
72
-
73
-
74
-
75
-
76
-
77
-
78
-
79
-
80
-
81
-
82
-
83
-
84
-
85
-
86
-
87
-
88
-
89
-
90
-
91
-
92
-
93
-
94
-
95
-
96
-
97
-
98
-
99
-
100
-
101
-
102
-
103
-
104
-
105
-
106
-
107
-
108
-
109
-
110
-
111
-
112
-
113
-
114
-
115
-
116
-
117
-
118
-
119
-
120
-
121
-
122
-
123
-
124
-
125
-
126
-
127
-
128
-
129
-
130
-
131
-
132
 |
 |

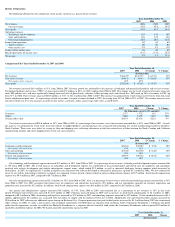
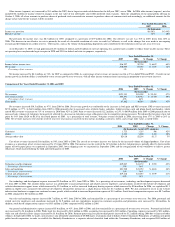
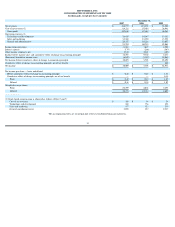
Interest expense decreased by $0.1 million, or 28%, for 2006, due primarily to a decrease in interest expense on capitalized lease obligations.
Other income (expense), net, totaled $2.4 million for 2006, an increase over the prior year other expense amount of $0.1 million. This income is due to larger invested cash
balances from our initial public offering and higher interest rates. For 2006, other income (expense), net also included $0.1 million of income related to changes in the fair value of our
redeemable convertible preferred stock warrants. Upon the completion of our initial public offering on October 4, 2006, all of our warrants to purchase shares of preferred stock
converted into warrants to purchase shares of common stock and accordingly, no additional amounts for the change in fair value for the warrants will be recorded.
The provision for income taxes was $3.9 million for 2006, compared to a benefit of $24.1 million for 2005, due to changes in our effective tax rate as a result of releasing our
valuation allowance in the fourth quarter of 2005.
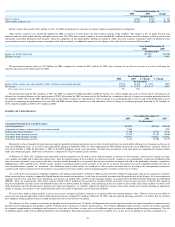
Net income decreased by $23.1 million, or 80%, for 2006 as compared to 2005. Included in 2005 net income was a $24.1 million non-
cash tax benefit due to releasing our net
deferred tax valuation allowance in the fourth quarter of 2005. Net income for 2005 also increased by $0.4 million for a cumulative effect of a change in accounting principle related to
the adoption of FSP 150-
5 in July 2005. We believe that income before income taxes and cumulative effect of change in accounting principle is relevant and useful information to assist
investors in comparing our performance between 2006 and 2005. Income before income taxes and cumulative effect of change in accounting principle increased by $5.3 million, or
120%, from $4.4 million in 2005 to $9.7 million in 2006.
Liquidity and Capital Resources
Historically we have financed our operations and capital expenditures through operations, private sales of preferred stock, our initial public offering, lease financing and the use of
bank and related-party loans. As a result of our initial public offering in September 2006, we raised approximately $80.9 million of proceeds, net of underwriters’
discount, which we
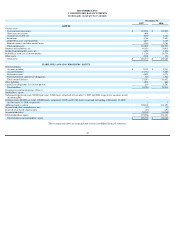
received on October 4, 2006. At December 31, 2007 we had $125.6 million of cash, cash equivalents, and short term investments. Cash equivalents are compromised of money market
funds and commercial paper. Short term investments is comprised of US government agency securities.
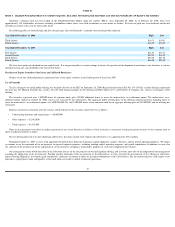
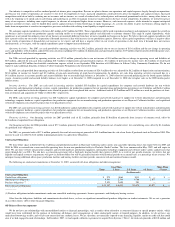
At February 29, 2008, $52.3 million of our marketable securities portfolio was invested in AAA rated investments in auction-rate debt securities. Auction-rate securities are long-
term variable rate bonds tied to short-
term interest rates. After the initial issuance of the securities, the interest rate on the securities is reset periodically, at intervals established at the
time of issuance (primarily every twenty-eight days), based on market demand for a reset period. Auction-
rate securities are bought and sold in the marketplace through a competitive
bidding process often referred to as a “Dutch auction”. If there is insufficient interest in the securities at the time of an auction, the auction
may not be completed and the rates may be
reset to predetermined “penalty” or “maximum” rates. Following such a failed auction, we would not be able to access our funds that are invested in the corresponding auction-
rate
securities until a future auction of these investments is successful or new buyers express interest in purchasing these securities in between reset dates.
As a result of the current negative liquidity conditions in the global credit markets, in February 2008, auctions for $42.3 million of original par value of our auction-
rate securities
failed, rendering these securities temporarily illiquid through the normal auction process. At the time of our initial investment and through the date of this Report, all of our auction-
rate
securities remain AAA rated. The assets underlying each security are student loans and 95% of the principal amounts are guaranteed by the Federal Family Education Loan Program
(FFELP). Since we cannot predict when future auctions related to $52.3 million of our auction-
rate securities will be successful, it may become necessary to classify this amount as
long-
term marketable securities in our consolidated balance sheet in future periods. In addition, if the underlying issuers are unable to successfully clear future auctions or if their credit
rating deteriorates and the deterioration is deemed to be other-than-temporary, we would be required to adjust the carrying value of the auction-
rate securities through an impairment
charge to earnings. Any of these events could materially affect our results of operations and our financial condition.
To access these funds in future periods, it may be necessary to attempt to sell these securities at an amount below our original purchase value. However, based on our ability to
access our cash and cash equivalents and our other liquid investments, totaling $53.7 million at February 29, 2008, and our expected operating cash flows, we believe that we currently
have adequate working capital resources to fund our operations for at least the next 12 months.
The adequacy of these resources to meeting our liquidity needs beyond the next 12 months will depend on our growth, operating results, the capital expenditures required to meet
possible increased demand for our products, and the resolution of the auction rate securities auction failures. If we require additional capital resources to grow our business internally
or to acquire complementary technologies and businesses at any time in the future, we may seek to sell additional equity or enter into working capital financing arrangements. The sale
of additional equity could result in additional dilution to our stockholders. Financing arrangements may not be available to us, or may not be in amounts or on terms acceptable to us.
Year Ended December 31,
2006
2005
Change
(in thousands)
Interest expense
$(266)
$(367)
$ 101
Other income (expense), net
$2,387
$(103)
$2,490
Year Ended December 31
2006
2005
(In thousands)
Income tax benefit (provision)
$(3,942)
$24,060
Effective tax rate
40%
494%
Year Ended December 31,
2006
2005
$ Change
% Change
(In thousands)
Income before income taxes and cumulative effect of change in accounting principle
$9,740
$4,430
$ 5,310
120%
Net income
$5,798
$ 28,932
$(23,134)
(80%)
Percentage of net revenue
5%
35%
-
-
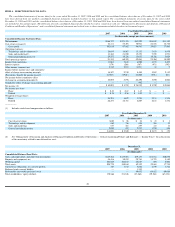
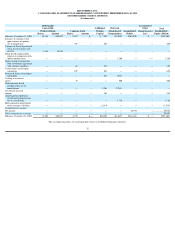
Year Ended December 31,
2007
2006
2005
(In thousands)
Consolidated Statement of Cash Flows Data:
Capital expenditures
$34,993
$20,681
$10,858
Acquisition of business and intangibles, net of cash acquired
2,858
-
(239)
Depreciation and amortization
17,796
10,747
6,522
Cash flows from operating activities
42,219
23,485
18,606
Cash flows from investing activities
(40,823)
(20,681)
(10,613)
Cash flows from financing activities
2,135
77,094
17,379
25