Samsung 1999 Annual Report Download - page 6
Download and view the complete annual report
Please find page 6 of the 1999 Samsung annual report below. You can navigate through the pages in the report by either clicking on the pages listed below, or by using the keyword search tool below to find specific information within the annual report.-
 1
1 -
 2
2 -
 3
3 -
 4
4 -
 5
5 -
 6
6 -
 7
7 -
 8
8 -
 9
9 -
 10
10 -
 11
11 -
 12
12 -
 13
13 -
 14
14 -
 15
15 -
 16
16 -
 17
17 -
18
-
19
-
20
-
21
-
22
-
23
-
24
-
25
-
26
-
27
-
28
-
29
-
30
-
31
-
32
-
33
-
34
-
35
-
36
-
37
-
38
-
39
-
40
-
41
-
42
-
43
-
44
-
45
-
46
-
47
-
48
-
49
-
50
-
51
-
52
-
53
-
54
-
55
-
56
-
57
-
58
-
59
-
60
-
61
-
62
-
63
-
64
-
65
-
66
-
67
-
68
-
69
-
70
-
71
-
72
-
73
-
74
-
75
-
76
-
77
-
78
-
79
-
80
-
81
-
82
-
83
 |
 |

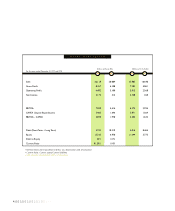
Sales 26,118 20,084 22,803 16,640
Gross Profit 8,457 6,108 7,383 5,061
Operating Profit 4,482 3,100 3,913 2,568
Net Income 3,170 313 2,768 260
EBITDA 7,300 3,616 6,375 2,996
CAPEX (Capital Expenditures) 3,402 1,646 2,971 1,364
EBITDA - CAPEX 3,898 1,970 3,404 1,632
Debt (Short Term + Long Term) 5,745 10,219 5,016 8,466
Equity 13,332 6,970 11,644 5,775
Debt to Equity 43% 147%
Current Ratio 91.39% 110%
VITAL STATISTICS
Billions of Korean Won Millions ofU.S. Dollars
99 98 99 98
For the years ended December 31, 1999 and 1998
40010010010100101
EBITDA means earnings before interest, tax, depreciation and amortization
Current Ratio: Current assets/Current liabilities
US$ amounts calculated at US$1=1,145.4 won