Samsung 1999 Annual Report Download - page 56
Download and view the complete annual report
Please find page 56 of the 1999 Samsung annual report below. You can navigate through the pages in the report by either clicking on the pages listed below, or by using the keyword search tool below to find specific information within the annual report.-
 1
1 -
2
-
3
-
4
-
5
-
6
-
7
-
8
-
9
-
10
-
11
-
12
-
13
-
14
-
15
-
16
-
17
-
18
-
19
-
20
-
21
-
22
-
23
-
24
-
25
-
26
-
27
-
28
-
29
-
30
-
31
-
32
-
33
-
34
-
35
-
36
-
37
-
38
-
39
-
40
-
41
-
42
-
43
-
44
-
45
-
 46
46 -
 47
47 -
 48
48 -
 49
49 -
 50
50 -
 51
51 -
 52
52 -
 53
53 -
 54
54 -
 55
55 -
 56
56 -
 57
57 -
 58
58 -
 59
59 -
 60
60 -
 61
61 -
 62
62 -
 63
63 -
 64
64 -
 65
65 -
 66
66 -
67
-
68
-
69
-
70
-
71
-
72
-
73
-
74
-
75
-
76
-
77
-
78
-
79
-
80
-
81
-
82
-
83
 |
 |
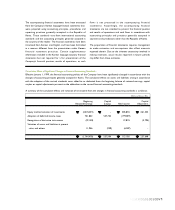
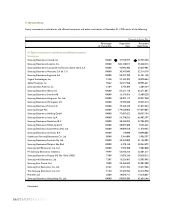
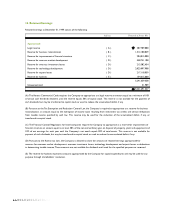
9. Investments:
Equity investments in subsidiaries and affiliated companies and other investments at December 31, 1999 consist of the following:
Thousands of Korean Won
Percentage Acquisition Recorded
of Ownership Cost Book Value
(1) Equity investments in subsidiaries and affiliated companies
Subsidiaries:
Samsung Electronics Canada, Inc. 100.00 37,910,597 32,929,230
Samsung Electronics America, Inc. 100.00 584,138,017 45,440,513
Samsung Electronics Latinoamerica Panama (Zone Libre) S.A. 100.00 43,842,300 33,029,905
Samsung Electronics Mexicana S.A. de C.V. 100.00 30,767,040 32,714,719
Samsung Electronics Argentina S.A. 100.00 50,227,700 31,361,130
Cagent Technologies, Inc. 91.48 22,162,492 18,970,664
Alpha Processor, Inc. 90.62 46,571,928 40,996,621
Samsung Glass America, Inc. 61.04 5,793,309 2,509,254
Samsung Electronics Iberia, S.A. 100.00 65,221,118 62,271,067
Samsung Electronics Svenska AB 100.00 16,153,454 12,480,220
Samsung Electronics Hungarian Co., Ltd. 100.00 48,397,117 49,027,338
Samsung Electronica Portuguesa S.A. 100.00 12,594,048 10,235,514
Samsung Electronics France S.A. 100.00 39,433,410 31,877,434
Samsung Europe PLC 100.00 179,626,805 177,064,807
Samsung Electronics Holding GmbH 100.00 77,607,622 58,537,194
Samsung Electronics Italia, S.p.A. 100.00 56,778,556 43,982,797
Samsung Electronics Nederland B.V. 100.00 38,334,024 37,706,970
Samsung Electronics Polska, Sp.Zo.O 100.00 20,097,600 9,456,425
Samsung Electronics South Africa (Pty) Ltd. 100.00 39,829,558 11,670,423
Samsung Electronics Overseas B.V. 100.00 119,898 10,648,885
Uzbekistan Samsung Electronica Co., Ltd. 80.00 3,341,000 5,936,797
Samsung Electronics Australia Pty. Ltd. 100.00 40,457,800 31,156,982
Samsung Electronics Malaysia Sdn. Bhd. 100.00 4,378,136 30,264,479
Samsung Gulf Electronics Co., Ltd. 100.00 7,976,308 9,682,868
P.T. Samsung Electronics Indonesia 99.99 56,910,316 22,601,517
Samsung Electronics Display (M) Sdn. Omd. (HSD) 75.00 21,876,246 29,620,515
Samsung India Electronics, Ltd. 73.87 15,526,467 15,387,943
Samsung Asia Private, Ltd. 70.00 20,454,044 53,907,380
Samsung Vina Electronics Co., Ltd. 81.62 13,531,704 15,677,406
Thai Samsung Electronics Co., Ltd. 91.50 37,422,945 25,416,928
PrimeTel, Ltd. 50.00 19,070,717 14,218,067
Samsung Electronics Hong Kong Co., Ltd. 100.00 69,029,200 62,634,166
Continued;
56001010010100101