Samsung 1999 Annual Report Download - page 47
Download and view the complete annual report
Please find page 47 of the 1999 Samsung annual report below. You can navigate through the pages in the report by either clicking on the pages listed below, or by using the keyword search tool below to find specific information within the annual report.-
 1
1 -
2
-
3
-
4
-
5
-
6
-
7
-
8
-
9
-
10
-
11
-
12
-
13
-
14
-
15
-
16
-
17
-
18
-
19
-
20
-
21
-
22
-
23
-
24
-
25
-
26
-
27
-
28
-
29
-
30
-
31
-
32
-
33
-
34
-
35
-
36
-
 37
37 -
 38
38 -
 39
39 -
 40
40 -
 41
41 -
 42
42 -
 43
43 -
 44
44 -
 45
45 -
 46
46 -
 47
47 -
 48
48 -
 49
49 -
 50
50 -
 51
51 -
 52
52 -
 53
53 -
 54
54 -
 55
55 -
 56
56 -
 57
57 -
58
-
59
-
60
-
61
-
62
-
63
-
64
-
65
-
66
-
67
-
68
-
69
-
70
-
71
-
72
-
73
-
74
-
75
-
76
-
77
-
78
-
79
-
80
-
81
-
82
-
83
 |
 |
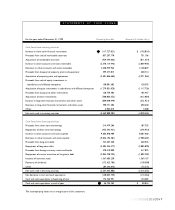
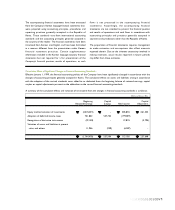
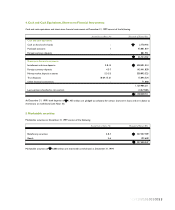
For the year ended December 31, 1999 Thousands of Korean Won Thousands of U.S. Dollars (Note 3)
Cash flows from investing activities:
Increase in short-term financial instruments (117,727,021) $ (102,818)
Proceeds from sale of marketable securities 837,207,770 731,186
Acquisition of marketable securities (929,344,062) (811,654)
Increase in other accounts and notes receivable (2,370,114,943) (2,069,969)
Decrease in other accounts and notes receivable 2,448,959,963 2,138,829
Proceeds from disposal of property, plant and equipment 399,277,815 348,714
Acquisition of property, plant and equipment (3,401,866,665) (2,971,063)
Proceeds from sale of equity investments in
subsidiaries and affiliated companies 138,081,682 120,595
Acquisition of equity investments in subsidiaries and affiliated companies (1,279,831,029) (1,117,756)
Proceeds from disposal of other investments 120,759,385 105,467
Acquisition of other investments (700,836,355) (612,084)
Increase in long-term financial instruments and other assets (609,048,949) (531,921)
Decrease in long-term financial instruments and other assets 790,771,403 690,630
Other 3,902,019 3,408
Net cash used in investing activities (4,669,808,987) (4,078,436)
Cash flows from financing activities:
Proceeds from short-term borrowings 214,979,206 187,755
Repayment of short-term borrowings (453,342,931) (395,933)
Increase in other accounts and notes payable 9,603,870,409 8,387,660
Decrease in other accounts and notes payable (9,046,194,581) (7,900,607)
Proceeds from long-term debt 722,407,330 630,923
Repayment of long-term debt (3,304,344,477) (2,885,890)
Proceeds from foreign currency notes and bonds 478,410,000 417,825
Repayment of current maturities of long-term debt (2,064,758,293) (1,803,282)
Issuance of common stock 1,567,684,230 1,369,157
Payments of dividends (172,423,703) (150,588)
Other (84,243,073) (73,575)
Net cash used in financing activities (2,537,955,883) (2,216,555)
Net decrease in cash and cash equivalents (130,032,729) (113,566)
Cash and cash equivalents at beginning of year 176,766,991 154,382
Cash and cash equivalents at end of year 46,734,262 $ 40,816
The accompanying notes are an integral part of this statement.
10101001010010047
STATEMENTS OF CASH FLOWS