Salesforce.com 2010 Annual Report Download - page 76
Download and view the complete annual report
Please find page 76 of the 2010 Salesforce.com annual report below. You can navigate through the pages in the report by either clicking on the pages listed below, or by using the keyword search tool below to find specific information within the annual report.-
 1
1 -
2
-
3
-
4
-
5
-
6
-
7
-
8
-
9
-
10
-
11
-
12
-
13
-
14
-
15
-
16
-
17
-
18
-
19
-
20
-
21
-
22
-
23
-
24
-
25
-
26
-
27
-
28
-
29
-
30
-
31
-
32
-
33
-
34
-
35
-
36
-
37
-
38
-
39
-
40
-
41
-
42
-
43
-
44
-
45
-
46
-
47
-
48
-
49
-
50
-
51
-
52
-
53
-
54
-
55
-
56
-
57
-
58
-
59
-
60
-
61
-
62
-
63
-
64
-
65
-
 66
66 -
 67
67 -
 68
68 -
 69
69 -
 70
70 -
 71
71 -
 72
72 -
 73
73 -
 74
74 -
 75
75 -
 76
76 -
 77
77 -
 78
78 -
 79
79 -
 80
80 -
 81
81 -
 82
82 -
 83
83 -
 84
84 -
 85
85 -
 86
86 -
87
-
88
-
89
-
90
-
91
-
92
-
93
-
94
-
95
-
96
-
97
-
98
-
99
-
100
-
101
-
102
-
103
-
104
-
105
-
106
-
107
-
108
-
109
-
110
-
111
-
112
-
113
-
114
-
115
-
116
-
117
-
118
-
119
-
120
-
121
-
122
-
123
-
124
-
125
-
126
-
127
-
128
-
129
-
130
-
131
-
132
-
133
-
134
-
135
-
136
-
137
-
138
-
139
-
140
-
141
-
142
-
143
-
144
-
145
-
146
-
147
-
148
-
149
-
150
-
151
-
152
-
153
-
154
-
155
-
156
-
157
-
158
-
159
-
160
-
161
-
162
-
163
-
164
-
165
-
166
-
167
-
168
-
169
-
170
-
171
-
172
-
173
-
174
-
175
-
176
-
177
-
178
-
179
-
180
-
181
-
182
-
183
-
184
-
185
-
186
-
187
-
188
-
189
-
190
-
191
-
192
-
193
-
194
-
195
-
196
-
197
-
198
-
199
-
200
-
201
-
202
-
203
-
204
-
205
-
206
-
207
-
208
-
209
-
210
-
211
-
212
-
213
-
214
-
215
-
216
-
217
-
218
-
219
-
220
-
221
-
222
-
223
-
224
-
225
-
226
-
227
-
228
-
229
-
230
-
231
-
232
-
233
-
234
-
235
-
236
-
237
-
238
-
239
-
240
-
241
-
242
-
243
-
244
-
245
-
246
-
247
-
248
-
249
-
250
-
251
-
252
-
253
-
254
-
255
-
256
-
257
-
258
-
259
-
260
-
261
-
262
-
263
-
264
-
265
-
266
-
267
-
268
-
269
-
270
-
271
-
272
-
273
-
274
-
275
-
276
-
277
-
278
-
279
-
280
-
281
-
282
-
283
-
284
-
285
-
286
-
287
-
288
-
289
-
290
-
291
-
292
-
293
-
294
-
295
-
296
-
297
-
298
-
299
-
300
-
301
-
302
-
303
-
304
-
305
-
306
-
307
-
308
-
309
-
310
-
311
-
312
-
313
-
314
-
315
-
316
-
317
-
318
-
319
-
320
-
321
-
322
-
323
-
324
-
325
-
326
 |
 |

Table of Contents
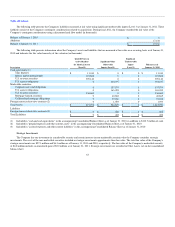
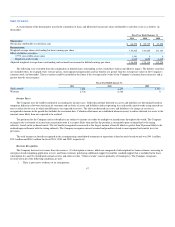
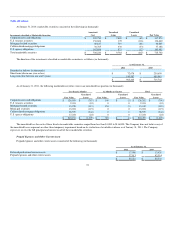
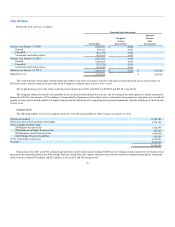
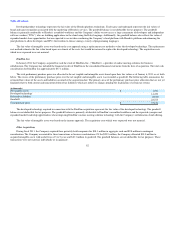
Property and Equipment
Property and equipment consisted of the following (in thousands):
As of January 31,
2011 2010
Land $ 248,263 $ 0
Buildings and improvements 10,115 0
Computers, equipment and software 115,736 87,608
Furniture and fixtures 20,462 17,325
Leasehold improvements 100,380 71,882
494,956 176,815
Less accumulated depreciation and amortization (107,782) (87,104)
$ 387,174 $ 89,711
Depreciation and amortization expense totaled $41.4 million, $31.9 million and $21.0 million during fiscal 2011, 2010, and 2009, respectively.
Property and equipment at January 31, 2011 and January 31, 2010 included a total of $38.8 million and $27.1 million acquired under capital lease
agreements, respectively. Accumulated amortization relating to equipment and software under capital leases totaled $18.5 million and $11.0 million,
respectively, at January 31, 2011 and January 31, 2010. Amortization of assets under capital leases is included in depreciation and amortization expense.
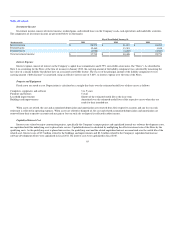
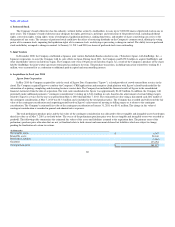
Land and buildings and improvements
During the fourth quarter of fiscal 2011, the Company purchased approximately 14 acres of undeveloped land in San Francisco, California, including
entitlements and improvements associated with the land, and perpetual parking rights in an existing garage for approximately $278.0 million in cash. The
Company plans to use the land to build a new global headquarters. During fiscal 2011, the Company recorded $248.3 million to the undeveloped land and
$6.4 million to buildings and improvements. The Company recorded $23.3 million for the perpetual parking rights as a purchased intangible asset in Other
Assets on the consolidated balance sheet.
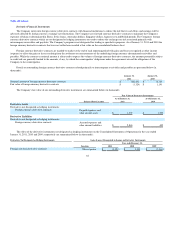
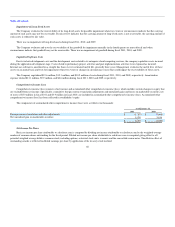
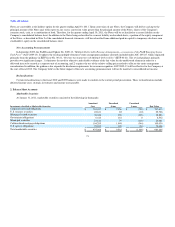
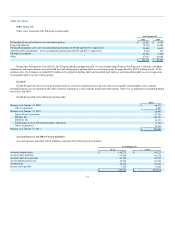
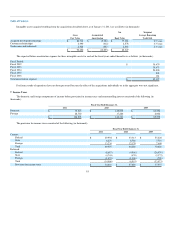
Capitalized Software
Capitalized software consisted of the following (in thousands):
As of January 31,
2011 2010
Capitalized internal-use software development costs, net of accumulated amortization of $34,513 and $21,392, respectively $ 29,154 $ 22,675
Acquired developed technology, net of accumulated amortization of $37,818 and $20,932, respectively 98,833 12,134
$ 127,987 $ 34,809
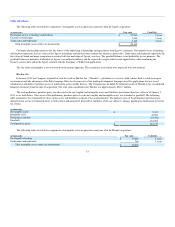
Capitalized internal-use software amortization expense totaled $13.1 million and $9.9 million for the years ended January 31, 2011 and 2010,
respectively. Acquired developed technology amortization expense totaled $16.9 million and $8.0 million for the years ended January 31, 2011 and 2010,
respectively.
73