Salesforce.com 2010 Annual Report Download - page 64
Download and view the complete annual report
Please find page 64 of the 2010 Salesforce.com annual report below. You can navigate through the pages in the report by either clicking on the pages listed below, or by using the keyword search tool below to find specific information within the annual report.-
 1
1 -
2
-
3
-
4
-
5
-
6
-
7
-
8
-
9
-
10
-
11
-
12
-
13
-
14
-
15
-
16
-
17
-
18
-
19
-
20
-
21
-
22
-
23
-
24
-
25
-
26
-
27
-
28
-
29
-
30
-
31
-
32
-
33
-
34
-
35
-
36
-
37
-
38
-
39
-
40
-
41
-
42
-
43
-
44
-
45
-
46
-
47
-
48
-
49
-
50
-
51
-
52
-
53
-
 54
54 -
 55
55 -
 56
56 -
 57
57 -
 58
58 -
 59
59 -
 60
60 -
 61
61 -
 62
62 -
 63
63 -
 64
64 -
 65
65 -
 66
66 -
 67
67 -
 68
68 -
 69
69 -
 70
70 -
 71
71 -
 72
72 -
 73
73 -
 74
74 -
75
-
76
-
77
-
78
-
79
-
80
-
81
-
82
-
83
-
84
-
85
-
86
-
87
-
88
-
89
-
90
-
91
-
92
-
93
-
94
-
95
-
96
-
97
-
98
-
99
-
100
-
101
-
102
-
103
-
104
-
105
-
106
-
107
-
108
-
109
-
110
-
111
-
112
-
113
-
114
-
115
-
116
-
117
-
118
-
119
-
120
-
121
-
122
-
123
-
124
-
125
-
126
-
127
-
128
-
129
-
130
-
131
-
132
-
133
-
134
-
135
-
136
-
137
-
138
-
139
-
140
-
141
-
142
-
143
-
144
-
145
-
146
-
147
-
148
-
149
-
150
-
151
-
152
-
153
-
154
-
155
-
156
-
157
-
158
-
159
-
160
-
161
-
162
-
163
-
164
-
165
-
166
-
167
-
168
-
169
-
170
-
171
-
172
-
173
-
174
-
175
-
176
-
177
-
178
-
179
-
180
-
181
-
182
-
183
-
184
-
185
-
186
-
187
-
188
-
189
-
190
-
191
-
192
-
193
-
194
-
195
-
196
-
197
-
198
-
199
-
200
-
201
-
202
-
203
-
204
-
205
-
206
-
207
-
208
-
209
-
210
-
211
-
212
-
213
-
214
-
215
-
216
-
217
-
218
-
219
-
220
-
221
-
222
-
223
-
224
-
225
-
226
-
227
-
228
-
229
-
230
-
231
-
232
-
233
-
234
-
235
-
236
-
237
-
238
-
239
-
240
-
241
-
242
-
243
-
244
-
245
-
246
-
247
-
248
-
249
-
250
-
251
-
252
-
253
-
254
-
255
-
256
-
257
-
258
-
259
-
260
-
261
-
262
-
263
-
264
-
265
-
266
-
267
-
268
-
269
-
270
-
271
-
272
-
273
-
274
-
275
-
276
-
277
-
278
-
279
-
280
-
281
-
282
-
283
-
284
-
285
-
286
-
287
-
288
-
289
-
290
-
291
-
292
-
293
-
294
-
295
-
296
-
297
-
298
-
299
-
300
-
301
-
302
-
303
-
304
-
305
-
306
-
307
-
308
-
309
-
310
-
311
-
312
-
313
-
314
-
315
-
316
-
317
-
318
-
319
-
320
-
321
-
322
-
323
-
324
-
325
-
326
 |
 |

Table of Contents
translated into U.S. dollars at the exchange rate on the balance sheet date. Revenues and expenses are translated at the average exchange rate during the
period. Equity transactions are translated using historical exchange rates.
Concentrations of Credit Risk and Significant Customers
The Company's financial instruments that are exposed to concentrations of credit risk consist primarily of cash and cash equivalents, marketable
securities and trade accounts receivable. Although the Company deposits its cash with multiple financial institutions, its deposits, at times, may exceed
federally insured limits. Collateral is not required for accounts receivable. The Company maintains an allowance for doubtful accounts receivable balances.
The allowance is based upon historical loss patterns, the number of days that billings are past due and an evaluation of the potential risk of loss associated
with delinquent accounts.
No customer accounted for more than 5 percent of accounts receivable at January 31, 2011 and 2010. No single customer accounted for 5 percent or
more of total revenue during fiscal 2011, 2010, and 2009.
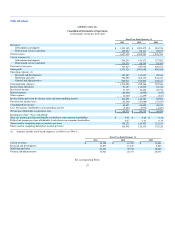
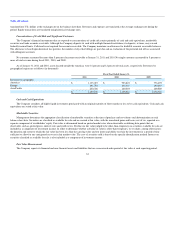
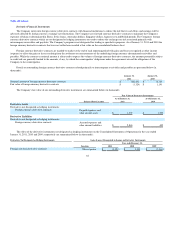
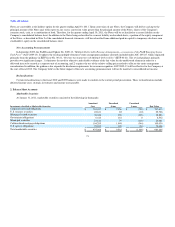
As of January 31, 2011 and 2010, assets located outside the Americas were 16 percent and 12 percent of total assets, respectively. Revenues by
geographical region are as follows (in thousands):
Fiscal Year Ended January 31,
2011 2010 2009
Revenues by geography:
Americas $ 1,135,019 $ 923,823 $ 776,495
Europe 291,784 232,367 190,685
Asia Pacific 230,336 149,393 109,589
$ 1,657,139 $ 1,305,583 $ 1,076,769
Cash and Cash Equivalents
The Company considers all highly liquid investments purchased with an original maturity of three months or less to be cash equivalents. Cash and cash
equivalents are stated at fair value.
Marketable Securities
Management determines the appropriate classification of marketable securities at the time of purchase and reevaluates such determination at each
balance sheet date. Securities are classified as available for sale and are carried at fair value, with the unrealized gains and losses, net of tax, reported as a
separate component of stockholders' equity. Fair value is determined based on quoted market rates when observable or utilizing data points that are
observable, such as quoted prices, interest rates and yield curves. Declines in fair value judged to be other-than-temporary on securities available for sale are
included as a component of investment income. In order to determine whether a decline in value is other-than-temporary, we evaluate, among other factors:
the duration and extent to which the fair value has been less than the carrying value and our intent and ability to retain the investment for a period of time
sufficient to allow for any anticipated recovery in fair market value. The cost of securities sold is based on the specific-identification method. Interest on
securities classified as available for sale is also included as a component of investment income.
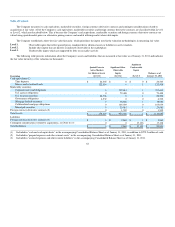
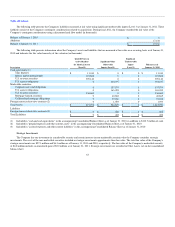
Fair Value Measurement
The Company reports its financial and non-financial assets and liabilities that are re-measured and reported at fair value at each reporting period.
61