Salesforce.com 2010 Annual Report Download - page 46
Download and view the complete annual report
Please find page 46 of the 2010 Salesforce.com annual report below. You can navigate through the pages in the report by either clicking on the pages listed below, or by using the keyword search tool below to find specific information within the annual report.-
 1
1 -
 2
2 -
 3
3 -
 4
4 -
 5
5 -
 6
6 -
 7
7 -
 8
8 -
 9
9 -
 10
10 -
 11
11 -
 12
12 -
 13
13 -
 14
14 -
 15
15 -
 16
16 -
 17
17 -
 18
18 -
 19
19 -
 20
20 -
 21
21 -
 22
22 -
 23
23 -
 24
24 -
 25
25 -
 26
26 -
 27
27 -
 28
28 -
 29
29 -
 30
30 -
 31
31 -
 32
32 -
 33
33 -
 34
34 -
 35
35 -
 36
36 -
 37
37 -
 38
38 -
 39
39 -
 40
40 -
 41
41 -
 42
42 -
 43
43 -
 44
44 -
 45
45 -
 46
46 -
 47
47 -
 48
48 -
 49
49 -
 50
50 -
 51
51 -
 52
52 -
 53
53 -
 54
54 -
 55
55 -
 56
56 -
 57
57 -
 58
58 -
 59
59 -
 60
60 -
 61
61 -
 62
62 -
 63
63 -
 64
64 -
 65
65 -
 66
66 -
 67
67 -
 68
68 -
 69
69 -
 70
70 -
 71
71 -
 72
72 -
 73
73 -
 74
74 -
 75
75 -
 76
76 -
 77
77 -
 78
78 -
 79
79 -
 80
80 -
 81
81 -
 82
82 -
 83
83 -
 84
84 -
 85
85 -
 86
86 -
 87
87 -
 88
88 -
 89
89 -
 90
90 -
 91
91 -
 92
92 -
 93
93 -
 94
94 -
 95
95 -
 96
96 -
 97
97 -
 98
98 -
 99
99 -
 100
100 -
 101
101 -
 102
102 -
 103
103 -
 104
104 -
 105
105 -
 106
106 -
 107
107 -
 108
108 -
 109
109 -
 110
110 -
 111
111 -
 112
112 -
 113
113 -
 114
114 -
 115
115 -
 116
116 -
 117
117 -
 118
118 -
 119
119 -
 120
120 -
 121
121 -
 122
122 -
 123
123 -
 124
124 -
 125
125 -
 126
126 -
 127
127 -
 128
128 -
 129
129 -
 130
130 -
 131
131 -
 132
132 -
 133
133 -
 134
134 -
 135
135 -
 136
136 -
 137
137 -
 138
138 -
 139
139 -
 140
140 -
 141
141 -
 142
142 -
 143
143 -
 144
144 -
 145
145 -
 146
146 -
 147
147 -
 148
148 -
 149
149 -
 150
150 -
 151
151 -
 152
152 -
 153
153 -
 154
154 -
 155
155 -
 156
156 -
 157
157 -
 158
158 -
 159
159 -
 160
160 -
 161
161 -
 162
162 -
 163
163 -
 164
164 -
 165
165 -
 166
166 -
 167
167 -
 168
168 -
 169
169 -
 170
170 -
 171
171 -
 172
172 -
 173
173 -
 174
174 -
 175
175 -
 176
176 -
 177
177 -
 178
178 -
 179
179 -
 180
180 -
 181
181 -
 182
182 -
 183
183 -
 184
184 -
 185
185 -
 186
186 -
 187
187 -
 188
188 -
 189
189 -
 190
190 -
 191
191 -
 192
192 -
 193
193 -
 194
194 -
 195
195 -
 196
196 -
 197
197 -
 198
198 -
 199
199 -
 200
200 -
 201
201 -
 202
202 -
 203
203 -
 204
204 -
 205
205 -
 206
206 -
 207
207 -
 208
208 -
 209
209 -
 210
210 -
 211
211 -
 212
212 -
 213
213 -
 214
214 -
 215
215 -
 216
216 -
 217
217 -
 218
218 -
 219
219 -
 220
220 -
 221
221 -
 222
222 -
 223
223 -
 224
224 -
 225
225 -
 226
226 -
 227
227 -
 228
228 -
 229
229 -
 230
230 -
 231
231 -
 232
232 -
 233
233 -
 234
234 -
 235
235 -
 236
236 -
 237
237 -
 238
238 -
 239
239 -
 240
240 -
 241
241 -
 242
242 -
 243
243 -
 244
244 -
 245
245 -
 246
246 -
 247
247 -
 248
248 -
 249
249 -
 250
250 -
 251
251 -
 252
252 -
 253
253 -
 254
254 -
 255
255 -
 256
256 -
 257
257 -
 258
258 -
 259
259 -
 260
260 -
 261
261 -
 262
262 -
 263
263 -
 264
264 -
 265
265 -
 266
266 -
 267
267 -
 268
268 -
 269
269 -
 270
270 -
 271
271 -
 272
272 -
 273
273 -
 274
274 -
 275
275 -
 276
276 -
 277
277 -
 278
278 -
 279
279 -
 280
280 -
 281
281 -
 282
282 -
 283
283 -
 284
284 -
 285
285 -
 286
286 -
 287
287 -
 288
288 -
 289
289 -
 290
290 -
 291
291 -
 292
292 -
 293
293 -
 294
294 -
 295
295 -
 296
296 -
 297
297 -
 298
298 -
 299
299 -
 300
300 -
 301
301 -
 302
302 -
 303
303 -
 304
304 -
 305
305 -
 306
306 -
 307
307 -
 308
308 -
 309
309 -
 310
310 -
 311
311 -
 312
312 -
 313
313 -
 314
314 -
 315
315 -
 316
316 -
 317
317 -
 318
318 -
 319
319 -
 320
320 -
 321
321 -
 322
322 -
 323
323 -
 324
324 -
 325
325 -
 326
326
 |
 |

Table of Contents
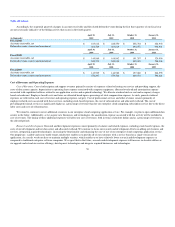
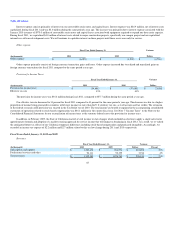
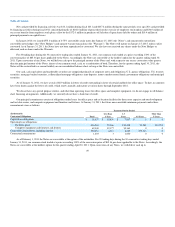
Cost of Revenues.
Fiscal Year Ended January 31, Variance
Dollars
(In thousands) 2011 2010
Subscription and support $ 208,243 $ 159,172 $ 49,071
Professional services and other 115,570 98,753 16,817
Total cost of revenues $ 323,813 $ 257,925 $ 65,888
Percent of total revenues 20% 20%
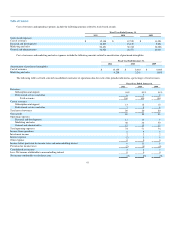
Cost of revenues was $323.8 million, or 20 percent of total revenues, during fiscal 2011, compared to $257.9 million, or 20 percent of total revenues,
during the same period a year ago, an increase of $65.9 million. The increase in absolute dollars was primarily due to an increase of $22.6 million in
employee-related costs, an increase of $9.2 million in service delivery costs, primarily due to our efforts in increasing data center capacity, an increase of
$16.6 million in depreciation and amortization expenses, an increase of $13.2 million in outside subcontractor and other service costs, and an increase of $3.6
million in allocated overhead, offset by a decrease of $0.4 million in stock based expenses. The cost of professional services and other revenues exceeded the
related revenue during fiscal 2011 by $9.6 million as compared to $2.6 million during fiscal 2010, primarily due to an increase in the cost related to
professional services headcount.
We intend to continue to invest additional resources in our enterprise cloud computing application service. The timing of these additional expenses, will
affect our cost of revenues, both in terms of absolute dollars and as a percentage of revenues in future periods.
We expect the cost of professional services to continue to exceed revenue from professional services during fiscal 2012. We believe that this investment
in professional services facilitates the adoption of our application service.
Research and Development.
Fiscal Year Ended January 31, Variance
Dollars
(In thousands) 2011 2010
Research and development $ 187,887 $ 131,897 $ 55,990
Percent of total revenues 11% 10%
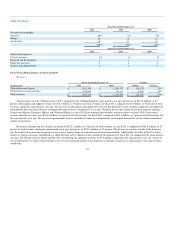
Research and development expenses were $187.9 million, or 11 percent of total revenues, during fiscal 2011, compared to $131.9 million, or 10 percent
of total revenues, during the same period a year ago, an increase of $56.0 million. The increase in absolute dollars was due to an increase of $42.0 million in
employee-related costs, an increase of $5.8 million in stock-based expenses, and an increase of $5.6 million in allocated overhead. We increased our research
and development headcount by 47 percent since January 31, 2010 in order to upgrade and extend our service offerings and develop new technologies. Some
of the increase in headcount was due to acquired businesses.
Marketing and Sales.
Fiscal Year Ended January 31, Variance
Dollars
(In thousands) 2011 2010
Marketing and sales $ 792,029 $ 605,199 $ 186,830
Percent of total revenues 48% 46%
43
