Salesforce.com 2010 Annual Report Download - page 60
Download and view the complete annual report
Please find page 60 of the 2010 Salesforce.com annual report below. You can navigate through the pages in the report by either clicking on the pages listed below, or by using the keyword search tool below to find specific information within the annual report.-
 1
1 -
2
-
3
-
4
-
5
-
6
-
7
-
8
-
9
-
10
-
11
-
12
-
13
-
14
-
15
-
16
-
17
-
18
-
19
-
20
-
21
-
22
-
23
-
24
-
25
-
26
-
27
-
28
-
29
-
30
-
31
-
32
-
33
-
34
-
35
-
36
-
37
-
38
-
39
-
40
-
41
-
42
-
43
-
44
-
45
-
46
-
47
-
48
-
49
-
 50
50 -
 51
51 -
 52
52 -
 53
53 -
 54
54 -
 55
55 -
 56
56 -
 57
57 -
 58
58 -
 59
59 -
 60
60 -
 61
61 -
 62
62 -
 63
63 -
 64
64 -
 65
65 -
 66
66 -
 67
67 -
 68
68 -
 69
69 -
 70
70 -
71
-
72
-
73
-
74
-
75
-
76
-
77
-
78
-
79
-
80
-
81
-
82
-
83
-
84
-
85
-
86
-
87
-
88
-
89
-
90
-
91
-
92
-
93
-
94
-
95
-
96
-
97
-
98
-
99
-
100
-
101
-
102
-
103
-
104
-
105
-
106
-
107
-
108
-
109
-
110
-
111
-
112
-
113
-
114
-
115
-
116
-
117
-
118
-
119
-
120
-
121
-
122
-
123
-
124
-
125
-
126
-
127
-
128
-
129
-
130
-
131
-
132
-
133
-
134
-
135
-
136
-
137
-
138
-
139
-
140
-
141
-
142
-
143
-
144
-
145
-
146
-
147
-
148
-
149
-
150
-
151
-
152
-
153
-
154
-
155
-
156
-
157
-
158
-
159
-
160
-
161
-
162
-
163
-
164
-
165
-
166
-
167
-
168
-
169
-
170
-
171
-
172
-
173
-
174
-
175
-
176
-
177
-
178
-
179
-
180
-
181
-
182
-
183
-
184
-
185
-
186
-
187
-
188
-
189
-
190
-
191
-
192
-
193
-
194
-
195
-
196
-
197
-
198
-
199
-
200
-
201
-
202
-
203
-
204
-
205
-
206
-
207
-
208
-
209
-
210
-
211
-
212
-
213
-
214
-
215
-
216
-
217
-
218
-
219
-
220
-
221
-
222
-
223
-
224
-
225
-
226
-
227
-
228
-
229
-
230
-
231
-
232
-
233
-
234
-
235
-
236
-
237
-
238
-
239
-
240
-
241
-
242
-
243
-
244
-
245
-
246
-
247
-
248
-
249
-
250
-
251
-
252
-
253
-
254
-
255
-
256
-
257
-
258
-
259
-
260
-
261
-
262
-
263
-
264
-
265
-
266
-
267
-
268
-
269
-
270
-
271
-
272
-
273
-
274
-
275
-
276
-
277
-
278
-
279
-
280
-
281
-
282
-
283
-
284
-
285
-
286
-
287
-
288
-
289
-
290
-
291
-
292
-
293
-
294
-
295
-
296
-
297
-
298
-
299
-
300
-
301
-
302
-
303
-
304
-
305
-
306
-
307
-
308
-
309
-
310
-
311
-
312
-
313
-
314
-
315
-
316
-
317
-
318
-
319
-
320
-
321
-
322
-
323
-
324
-
325
-
326
 |
 |
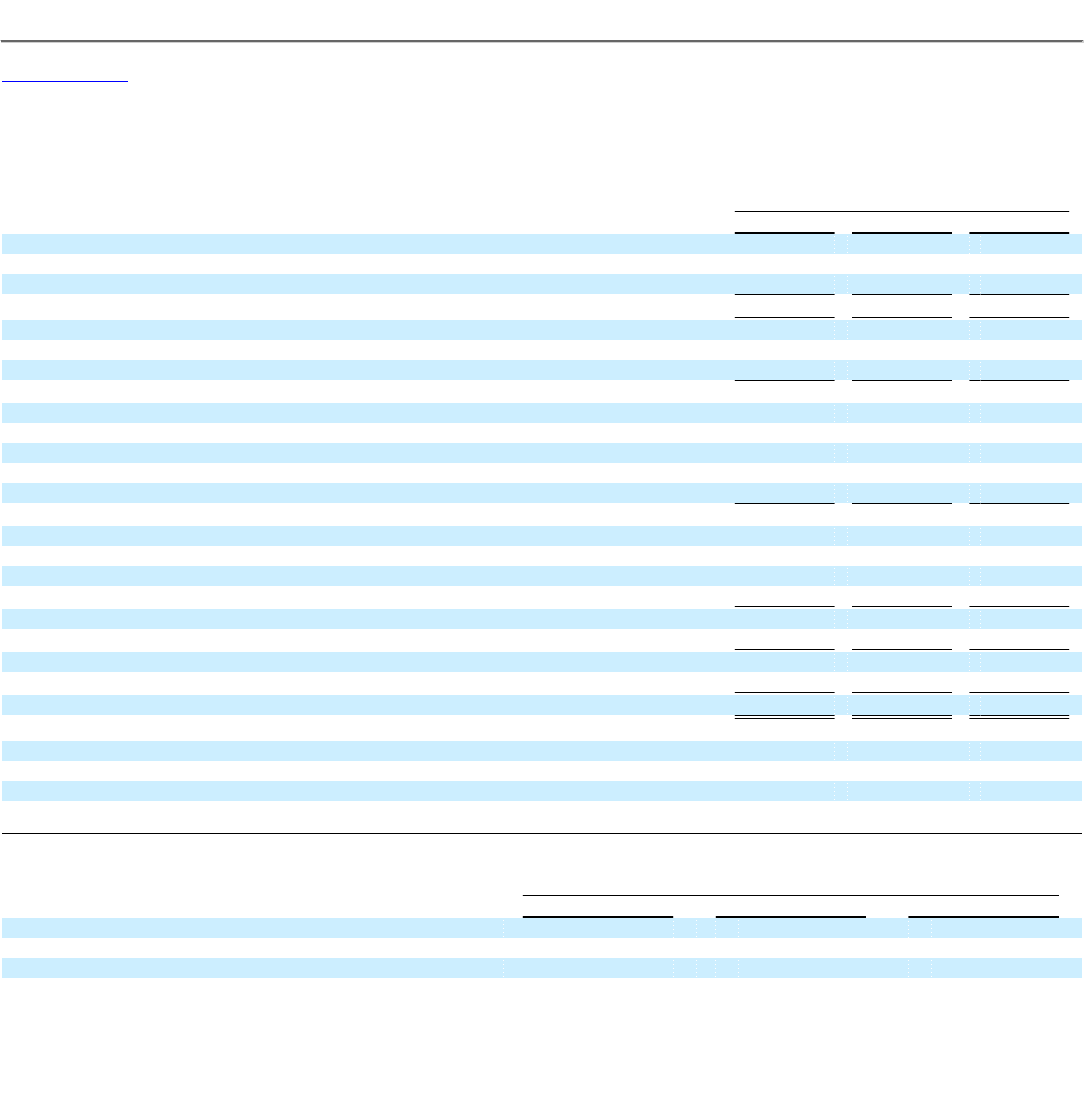
Table of Contents
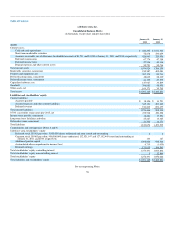
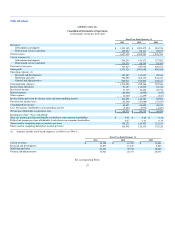
salesforce.com, inc.
Consolidated Statements of Operations
(in thousands, except per share data)
Fiscal Year Ended January 31,
2011 2010 2009
Revenues:
Subscription and support $ 1,551,145 $ 1,209,472 $ 984,574
Professional services and other 105,994 96,111 92,195
Total revenues 1,657,139 1,305,583 1,076,769
Cost of revenues (1):
Subscription and support 208,243 159,172 127,082
Professional services and other 115,570 98,753 93,389
Total cost of revenues 323,813 257,925 220,471
Gross profit 1,333,326 1,047,658 856,298
Operating expenses (1):
Research and development 187,887 131,897 99,530
Marketing and sales 792,029 605,199 534,413
General and administrative 255,913 195,290 158,613
Total operating expenses 1,235,829 932,386 792,556
Income from operations 97,497 115,272 63,742
Investment income 37,735 30,408 22,774
Interest expense (24,909) (2,000) (107)
Other expense (6,025) (1,299) (817)
Income before provision for income taxes and noncontrolling interest 104,298 142,381 85,592
Provision for income taxes (34,601) (57,689) (37,557)
Consolidated net income 69,697 84,692 48,035
Less: Net income attributable to noncontrolling interest (5,223) (3,973) (4,607)
Net income attributable to salesforce.com $ 64,474 $ 80,719 $ 43,428
Earnings per share—basic and diluted:
Basic net income per share attributable to salesforce.com common shareholders $ 0.50 $ 0.65 $ 0.36
Diluted net income per share attributable to salesforce.com common shareholders 0.47 0.63 0.35
Shares used in computing basic net income per share 130,222 124,462 121,183
Shares used in computing diluted net income per share 136,598 128,114 125,228
(1) Amounts include stock-based expenses, as follows (see Note 1):
Fiscal Year Ended January 31,
2011 2010 2009
Cost of revenues $ 12,158 $ 12,570 $ 11,051
Research and development 18,897 13,129 9,852
Marketing and sales 56,451 39,722 36,028
General and administrative 32,923 23,471 20,435
See accompanying Notes.
57