Salesforce.com 2010 Annual Report Download - page 59
Download and view the complete annual report
Please find page 59 of the 2010 Salesforce.com annual report below. You can navigate through the pages in the report by either clicking on the pages listed below, or by using the keyword search tool below to find specific information within the annual report.-
 1
1 -
2
-
3
-
4
-
5
-
6
-
7
-
8
-
9
-
10
-
11
-
12
-
13
-
14
-
15
-
16
-
17
-
18
-
19
-
20
-
21
-
22
-
23
-
24
-
25
-
26
-
27
-
28
-
29
-
30
-
31
-
32
-
33
-
34
-
35
-
36
-
37
-
38
-
39
-
40
-
41
-
42
-
43
-
44
-
45
-
46
-
47
-
48
-
 49
49 -
 50
50 -
 51
51 -
 52
52 -
 53
53 -
 54
54 -
 55
55 -
 56
56 -
 57
57 -
 58
58 -
 59
59 -
 60
60 -
 61
61 -
 62
62 -
 63
63 -
 64
64 -
 65
65 -
 66
66 -
 67
67 -
 68
68 -
 69
69 -
70
-
71
-
72
-
73
-
74
-
75
-
76
-
77
-
78
-
79
-
80
-
81
-
82
-
83
-
84
-
85
-
86
-
87
-
88
-
89
-
90
-
91
-
92
-
93
-
94
-
95
-
96
-
97
-
98
-
99
-
100
-
101
-
102
-
103
-
104
-
105
-
106
-
107
-
108
-
109
-
110
-
111
-
112
-
113
-
114
-
115
-
116
-
117
-
118
-
119
-
120
-
121
-
122
-
123
-
124
-
125
-
126
-
127
-
128
-
129
-
130
-
131
-
132
-
133
-
134
-
135
-
136
-
137
-
138
-
139
-
140
-
141
-
142
-
143
-
144
-
145
-
146
-
147
-
148
-
149
-
150
-
151
-
152
-
153
-
154
-
155
-
156
-
157
-
158
-
159
-
160
-
161
-
162
-
163
-
164
-
165
-
166
-
167
-
168
-
169
-
170
-
171
-
172
-
173
-
174
-
175
-
176
-
177
-
178
-
179
-
180
-
181
-
182
-
183
-
184
-
185
-
186
-
187
-
188
-
189
-
190
-
191
-
192
-
193
-
194
-
195
-
196
-
197
-
198
-
199
-
200
-
201
-
202
-
203
-
204
-
205
-
206
-
207
-
208
-
209
-
210
-
211
-
212
-
213
-
214
-
215
-
216
-
217
-
218
-
219
-
220
-
221
-
222
-
223
-
224
-
225
-
226
-
227
-
228
-
229
-
230
-
231
-
232
-
233
-
234
-
235
-
236
-
237
-
238
-
239
-
240
-
241
-
242
-
243
-
244
-
245
-
246
-
247
-
248
-
249
-
250
-
251
-
252
-
253
-
254
-
255
-
256
-
257
-
258
-
259
-
260
-
261
-
262
-
263
-
264
-
265
-
266
-
267
-
268
-
269
-
270
-
271
-
272
-
273
-
274
-
275
-
276
-
277
-
278
-
279
-
280
-
281
-
282
-
283
-
284
-
285
-
286
-
287
-
288
-
289
-
290
-
291
-
292
-
293
-
294
-
295
-
296
-
297
-
298
-
299
-
300
-
301
-
302
-
303
-
304
-
305
-
306
-
307
-
308
-
309
-
310
-
311
-
312
-
313
-
314
-
315
-
316
-
317
-
318
-
319
-
320
-
321
-
322
-
323
-
324
-
325
-
326
 |
 |

Table of Contents
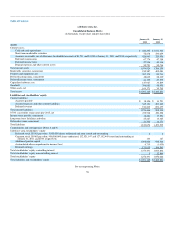
salesforce.com, inc.
Consolidated Balance Sheets
(in thousands, except share and per share data)
January 31,
2011
January 31,
2010
Assets
Current assets:
Cash and cash equivalents $ 424,292 $1,011,306
Short-term marketable securities 72,678 230,659
Accounts receivable, net of allowance for doubtful accounts of $1,711 and $1,050 at January 31, 2011 and 2010, respectively 426,943 320,956
Deferred commissions 67,774 47,388
Deferred income taxes 27,516 40,116
Prepaid expenses and other current assets 55,721 55,734
Total current assets 1,074,924 1,706,159
Marketable securities, noncurrent 910,587 485,083
Property and equipment, net 387,174 89,711
Deferred commissions, noncurrent 48,842 28,140
Deferred income taxes, noncurrent 41,199 27,579
Capitalized software, net 127,987 34,809
Goodwill 396,081 48,955
Other assets, net 104,371 39,765
Total assets $3,091,165 $2,460,201
Liabilities and stockholders' equity
Current liabilities:
Accounts payable $ 18,106 $ 14,791
Accrued expenses and other current liabilities 345,121 203,162
Deferred revenue 913,239 690,177
Total current liabilities 1,276,466 908,130
0.75% convertible senior notes due 2015, net 472,538 450,198
Income taxes payable, noncurrent 18,481 17,551
Long-term lease liabilities and other 25,487 13,485
Deferred revenue, noncurrent 21,702 14,171
Total liabilities 1,814,674 1,403,535
Commitments and contingencies (Notes 8 and 9)
Salesforce.com stockholders' equity:
Preferred stock, $0.001 par value; 5,000,000 shares authorized and none issued and outstanding 0 0
Common stock, $0.001 par value; 400,000,000 shares authorized, 132,921,147 and 127,152,449 issued and outstanding at
January 31, 2011 and 2010, respectively 133 127
Additional paid-in capital 1,098,604 938,544
Accumulated other comprehensive income (loss) 6,719 (1,430)
Retained earnings 171,035 106,561
Total stockholders' equity controlling interest 1,276,491 1,043,802
Total stockholders' equity noncontrolling interest 0 12,864
Total stockholders' equity 1,276,491 1,056,666
Total liabilities and stockholders' equity $3,091,165 $2,460,201
See accompanying Notes.
56