Salesforce.com 2010 Annual Report Download - page 72
Download and view the complete annual report
Please find page 72 of the 2010 Salesforce.com annual report below. You can navigate through the pages in the report by either clicking on the pages listed below, or by using the keyword search tool below to find specific information within the annual report.-
 1
1 -
2
-
3
-
4
-
5
-
6
-
7
-
8
-
9
-
10
-
11
-
12
-
13
-
14
-
15
-
16
-
17
-
18
-
19
-
20
-
21
-
22
-
23
-
24
-
25
-
26
-
27
-
28
-
29
-
30
-
31
-
32
-
33
-
34
-
35
-
36
-
37
-
38
-
39
-
40
-
41
-
42
-
43
-
44
-
45
-
46
-
47
-
48
-
49
-
50
-
51
-
52
-
53
-
54
-
55
-
56
-
57
-
58
-
59
-
60
-
61
-
 62
62 -
 63
63 -
 64
64 -
 65
65 -
 66
66 -
 67
67 -
 68
68 -
 69
69 -
 70
70 -
 71
71 -
 72
72 -
 73
73 -
 74
74 -
 75
75 -
 76
76 -
 77
77 -
 78
78 -
 79
79 -
 80
80 -
 81
81 -
 82
82 -
83
-
84
-
85
-
86
-
87
-
88
-
89
-
90
-
91
-
92
-
93
-
94
-
95
-
96
-
97
-
98
-
99
-
100
-
101
-
102
-
103
-
104
-
105
-
106
-
107
-
108
-
109
-
110
-
111
-
112
-
113
-
114
-
115
-
116
-
117
-
118
-
119
-
120
-
121
-
122
-
123
-
124
-
125
-
126
-
127
-
128
-
129
-
130
-
131
-
132
-
133
-
134
-
135
-
136
-
137
-
138
-
139
-
140
-
141
-
142
-
143
-
144
-
145
-
146
-
147
-
148
-
149
-
150
-
151
-
152
-
153
-
154
-
155
-
156
-
157
-
158
-
159
-
160
-
161
-
162
-
163
-
164
-
165
-
166
-
167
-
168
-
169
-
170
-
171
-
172
-
173
-
174
-
175
-
176
-
177
-
178
-
179
-
180
-
181
-
182
-
183
-
184
-
185
-
186
-
187
-
188
-
189
-
190
-
191
-
192
-
193
-
194
-
195
-
196
-
197
-
198
-
199
-
200
-
201
-
202
-
203
-
204
-
205
-
206
-
207
-
208
-
209
-
210
-
211
-
212
-
213
-
214
-
215
-
216
-
217
-
218
-
219
-
220
-
221
-
222
-
223
-
224
-
225
-
226
-
227
-
228
-
229
-
230
-
231
-
232
-
233
-
234
-
235
-
236
-
237
-
238
-
239
-
240
-
241
-
242
-
243
-
244
-
245
-
246
-
247
-
248
-
249
-
250
-
251
-
252
-
253
-
254
-
255
-
256
-
257
-
258
-
259
-
260
-
261
-
262
-
263
-
264
-
265
-
266
-
267
-
268
-
269
-
270
-
271
-
272
-
273
-
274
-
275
-
276
-
277
-
278
-
279
-
280
-
281
-
282
-
283
-
284
-
285
-
286
-
287
-
288
-
289
-
290
-
291
-
292
-
293
-
294
-
295
-
296
-
297
-
298
-
299
-
300
-
301
-
302
-
303
-
304
-
305
-
306
-
307
-
308
-
309
-
310
-
311
-
312
-
313
-
314
-
315
-
316
-
317
-
318
-
319
-
320
-
321
-
322
-
323
-
324
-
325
-
326
 |
 |

Table of Contents
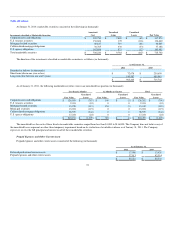
The commissions are deferred and amortized over the non-cancelable terms of the related customer contracts, which are typically 12 to 24 months. The
commission payments are paid in full the month after the customer's service commences. The deferred commission amounts are recoverable through the
future revenue streams under the non-cancelable customer contracts. The Company believes this is the preferable method of accounting as the commission
charges are so closely related to the revenue from the non-cancelable customer contracts that they should be recorded as an asset and charged to expense over
the same period that the subscription revenue is recognized. Amortization of deferred commissions is included in marketing and sales expense in the
accompanying consolidated statements of operations.
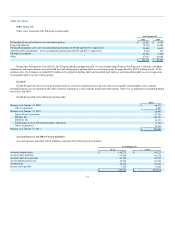
Business Combinations
The Company recognizes separately from goodwill the fair value of assets acquired and the liabilities assumed. Goodwill as of the acquisition date is
measured as the excess of consideration transferred and the net of the acquisition date fair values of the assets acquired and the liabilities assumed. While the
Company uses its best estimates and assumptions as a part of the purchase price allocation process to accurately value assets acquired and liabilities assumed
at the acquisition date, the Company's estimates are inherently uncertain and subject to refinement. As a result, during the measurement period, which may be
up to one year from the acquisition date, the Company may record adjustments to the fair value of assets acquired and liabilities assumed, with the
corresponding offset to goodwill. Upon the conclusion of the measurement period or final determination of the fair value of assets acquired or liabilities
assumed, whichever comes first, any subsequent adjustments are recorded to the Company's consolidated statements of operations.
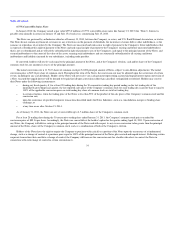
In addition, uncertain tax positions and tax related valuation allowances assumed in connection with a business combination are initially estimated as of
the acquisition date. The Company reevaluates these items quarterly and records any adjustments to the Company's preliminary estimates to goodwill
provided that the Company is within the measurement period and the Company continues to collect information in order to determine their estimated fair
values as of the date of acquisition. Subsequent to the measurement period or the Company's final determination of the tax allowance's or contingency's
estimated value, changes to these uncertain tax positions and tax related valuation allowances will affect the Company's provision for income taxes in the
Company's consolidated statement of operations.
Accounting for Stock-Based Compensation
The Company recognizes share-based expenses on a straight-line over the requisite service period of the awards, which is the vesting term of four years.
Stock-based expenses are recognized net of estimated forfeiture activity.
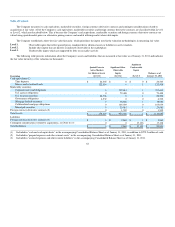
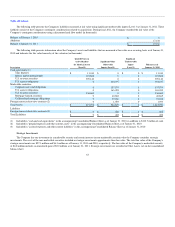
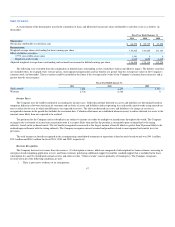
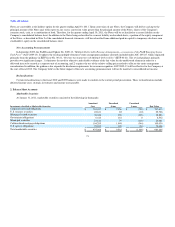
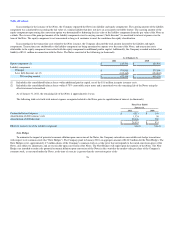
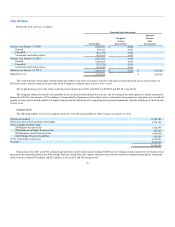
The fair value of each option grant was estimated on the date of grant using the Black-Scholes option pricing model with the following assumptions and
fair value per share:
2011 2010 2009
Volatility 45 - 50% 50 - 60% 47 - 60%
Estimated life 3.7 - 3.8 years 3.8 - 4 years 4 years
Weighted-average risk-free interest rate 0.98 - 2.1% 1.78 - 2.39% 1.47 - 3.08%
Dividend yield 0 0 0
Weighted-average fair value per share of grants $48.83 $24.73 $15.39
Since November 2009, the weighted-average estimated life was based on an actual analysis of expected life. Prior to November 2009, the weighted-
average estimated life assumption of 4 years was based on the average of the vesting term and the 5 year contractual lives of options awarded. The weighted
average risk free interest rate is based on the rate for a 4 year U.S. government security at the time of the option grant.
69