Salesforce.com 2010 Annual Report Download - page 45
Download and view the complete annual report
Please find page 45 of the 2010 Salesforce.com annual report below. You can navigate through the pages in the report by either clicking on the pages listed below, or by using the keyword search tool below to find specific information within the annual report.-
 1
1 -
2
-
3
-
4
-
5
-
6
-
7
-
8
-
9
-
10
-
11
-
12
-
13
-
14
-
15
-
16
-
17
-
18
-
19
-
20
-
21
-
22
-
23
-
24
-
25
-
26
-
27
-
28
-
29
-
30
-
31
-
32
-
33
-
34
-
 35
35 -
 36
36 -
 37
37 -
 38
38 -
 39
39 -
 40
40 -
 41
41 -
 42
42 -
 43
43 -
 44
44 -
 45
45 -
 46
46 -
 47
47 -
 48
48 -
 49
49 -
 50
50 -
 51
51 -
 52
52 -
 53
53 -
 54
54 -
 55
55 -
56
-
57
-
58
-
59
-
60
-
61
-
62
-
63
-
64
-
65
-
66
-
67
-
68
-
69
-
70
-
71
-
72
-
73
-
74
-
75
-
76
-
77
-
78
-
79
-
80
-
81
-
82
-
83
-
84
-
85
-
86
-
87
-
88
-
89
-
90
-
91
-
92
-
93
-
94
-
95
-
96
-
97
-
98
-
99
-
100
-
101
-
102
-
103
-
104
-
105
-
106
-
107
-
108
-
109
-
110
-
111
-
112
-
113
-
114
-
115
-
116
-
117
-
118
-
119
-
120
-
121
-
122
-
123
-
124
-
125
-
126
-
127
-
128
-
129
-
130
-
131
-
132
-
133
-
134
-
135
-
136
-
137
-
138
-
139
-
140
-
141
-
142
-
143
-
144
-
145
-
146
-
147
-
148
-
149
-
150
-
151
-
152
-
153
-
154
-
155
-
156
-
157
-
158
-
159
-
160
-
161
-
162
-
163
-
164
-
165
-
166
-
167
-
168
-
169
-
170
-
171
-
172
-
173
-
174
-
175
-
176
-
177
-
178
-
179
-
180
-
181
-
182
-
183
-
184
-
185
-
186
-
187
-
188
-
189
-
190
-
191
-
192
-
193
-
194
-
195
-
196
-
197
-
198
-
199
-
200
-
201
-
202
-
203
-
204
-
205
-
206
-
207
-
208
-
209
-
210
-
211
-
212
-
213
-
214
-
215
-
216
-
217
-
218
-
219
-
220
-
221
-
222
-
223
-
224
-
225
-
226
-
227
-
228
-
229
-
230
-
231
-
232
-
233
-
234
-
235
-
236
-
237
-
238
-
239
-
240
-
241
-
242
-
243
-
244
-
245
-
246
-
247
-
248
-
249
-
250
-
251
-
252
-
253
-
254
-
255
-
256
-
257
-
258
-
259
-
260
-
261
-
262
-
263
-
264
-
265
-
266
-
267
-
268
-
269
-
270
-
271
-
272
-
273
-
274
-
275
-
276
-
277
-
278
-
279
-
280
-
281
-
282
-
283
-
284
-
285
-
286
-
287
-
288
-
289
-
290
-
291
-
292
-
293
-
294
-
295
-
296
-
297
-
298
-
299
-
300
-
301
-
302
-
303
-
304
-
305
-
306
-
307
-
308
-
309
-
310
-
311
-
312
-
313
-
314
-
315
-
316
-
317
-
318
-
319
-
320
-
321
-
322
-
323
-
324
-
325
-
326
 |
 |

Table of Contents
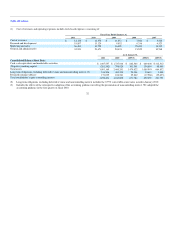
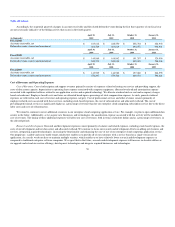
Fiscal Year Ended January 31,
2011 2010 2009
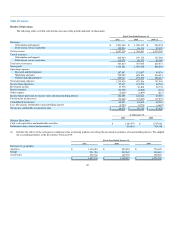
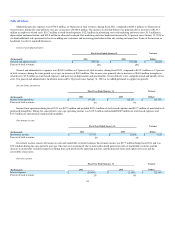
Revenues by geography:
Americas 68% 71% 72%
Europe 18 18 18
Asia Pacific 14 11 10
100% 100% 100%
Fiscal Year Ended January 31,
2011 2010 2009
Stock-based expenses:
Cost of revenues 1% 1% 1%
Research and development 1 1 1
Marketing and sales 3 3 3
General and administrative 2 2 2
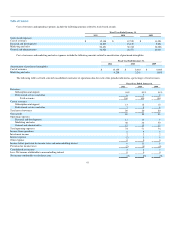
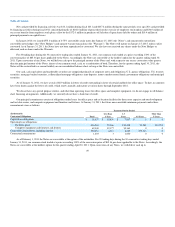
Fiscal Years Ended January 31, 2011 and 2010
Revenues.
Fiscal Year Ended January 31, Variance
(In thousands) 2011 2010 Dollars Percent
Subscription and support $ 1,551,145 $ 1,209,472 $ 341,673 28%
Professional services and other 105,994 96,111 9,883 10%
Total revenues $ 1,657,139 $ 1,305,583 $ 351,556 27%
Total revenues were $1.7 billion for fiscal 2011, compared to $1.3 billion during the same period a year ago, an increase of $351.6 million, or 27
percent. Subscription and support revenues were $1.6 billion, or 94 percent of total revenues, for fiscal 2011, compared to $1.2 billion, or 93 percent of total
revenues, during the same period a year ago. The increase in subscription and support revenues was due primarily to new customers, upgrades and additional
subscriptions from existing customers and improved renewal rates as compared to a year ago. The price per user per month for our three primary offerings,
Professional Edition, Enterprise Edition and Unlimited Edition, in fiscal 2011 has remained substantially consistent relative to fiscal 2010. Professional
services and other revenues were $106.0 million, or 6 percent of total revenues, for fiscal 2011, compared to $96.1 million, or 7 percent of total revenues, for
the same period a year ago. The increase in professional services and other revenues was due primarily to the higher demand for services from an increased
number of customers.
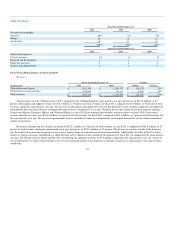
Revenues in Europe and Asia Pacific accounted for $522.1 million, or 32 percent of total revenues, for fiscal 2011, compared to $381.8 million, or 29
percent of total revenues, during the same period a year ago, an increase of $140.3 million, or 37 percent. The increase in revenues outside of the Americas
was the result of the increasing acceptance of our service, and our focus on marketing our service internationally. Additionally, the value of the U.S. dollar
relative to foreign currencies contributed to a slight decrease in U.S. dollar revenues outside of the Americas for fiscal 2011 as compared to the same period a
year ago. The foreign currency impact had the effect of reducing our aggregate revenues by $7.6 million compared to the same period a year ago. As part of
our overall growth, we expect the percentage of our revenue generated outside of the Americas to continue to increase as a percentage of our total revenues
world wide.
42