Salesforce.com 2010 Annual Report Download - page 62
Download and view the complete annual report
Please find page 62 of the 2010 Salesforce.com annual report below. You can navigate through the pages in the report by either clicking on the pages listed below, or by using the keyword search tool below to find specific information within the annual report.-
 1
1 -
2
-
3
-
4
-
5
-
6
-
7
-
8
-
9
-
10
-
11
-
12
-
13
-
14
-
15
-
16
-
17
-
18
-
19
-
20
-
21
-
22
-
23
-
24
-
25
-
26
-
27
-
28
-
29
-
30
-
31
-
32
-
33
-
34
-
35
-
36
-
37
-
38
-
39
-
40
-
41
-
42
-
43
-
44
-
45
-
46
-
47
-
48
-
49
-
50
-
51
-
 52
52 -
 53
53 -
 54
54 -
 55
55 -
 56
56 -
 57
57 -
 58
58 -
 59
59 -
 60
60 -
 61
61 -
 62
62 -
 63
63 -
 64
64 -
 65
65 -
 66
66 -
 67
67 -
 68
68 -
 69
69 -
 70
70 -
 71
71 -
 72
72 -
73
-
74
-
75
-
76
-
77
-
78
-
79
-
80
-
81
-
82
-
83
-
84
-
85
-
86
-
87
-
88
-
89
-
90
-
91
-
92
-
93
-
94
-
95
-
96
-
97
-
98
-
99
-
100
-
101
-
102
-
103
-
104
-
105
-
106
-
107
-
108
-
109
-
110
-
111
-
112
-
113
-
114
-
115
-
116
-
117
-
118
-
119
-
120
-
121
-
122
-
123
-
124
-
125
-
126
-
127
-
128
-
129
-
130
-
131
-
132
-
133
-
134
-
135
-
136
-
137
-
138
-
139
-
140
-
141
-
142
-
143
-
144
-
145
-
146
-
147
-
148
-
149
-
150
-
151
-
152
-
153
-
154
-
155
-
156
-
157
-
158
-
159
-
160
-
161
-
162
-
163
-
164
-
165
-
166
-
167
-
168
-
169
-
170
-
171
-
172
-
173
-
174
-
175
-
176
-
177
-
178
-
179
-
180
-
181
-
182
-
183
-
184
-
185
-
186
-
187
-
188
-
189
-
190
-
191
-
192
-
193
-
194
-
195
-
196
-
197
-
198
-
199
-
200
-
201
-
202
-
203
-
204
-
205
-
206
-
207
-
208
-
209
-
210
-
211
-
212
-
213
-
214
-
215
-
216
-
217
-
218
-
219
-
220
-
221
-
222
-
223
-
224
-
225
-
226
-
227
-
228
-
229
-
230
-
231
-
232
-
233
-
234
-
235
-
236
-
237
-
238
-
239
-
240
-
241
-
242
-
243
-
244
-
245
-
246
-
247
-
248
-
249
-
250
-
251
-
252
-
253
-
254
-
255
-
256
-
257
-
258
-
259
-
260
-
261
-
262
-
263
-
264
-
265
-
266
-
267
-
268
-
269
-
270
-
271
-
272
-
273
-
274
-
275
-
276
-
277
-
278
-
279
-
280
-
281
-
282
-
283
-
284
-
285
-
286
-
287
-
288
-
289
-
290
-
291
-
292
-
293
-
294
-
295
-
296
-
297
-
298
-
299
-
300
-
301
-
302
-
303
-
304
-
305
-
306
-
307
-
308
-
309
-
310
-
311
-
312
-
313
-
314
-
315
-
316
-
317
-
318
-
319
-
320
-
321
-
322
-
323
-
324
-
325
-
326
 |
 |

Table of Contents
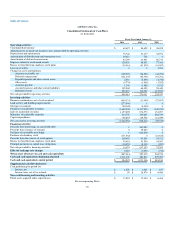
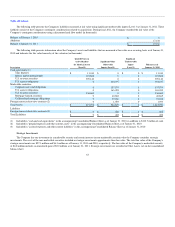
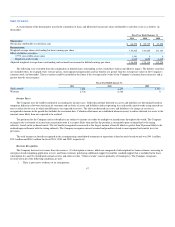
salesforce.com, inc.
Consolidated Statements of Cash Flows
(in thousands)
Fiscal Year Ended January 31,
2011 2010 2009
Operating activities:
Consolidated net income $ 69,697 $ 84,692 $ 48,035
Adjustments to reconcile net income to net cash provided by operating activities:
Depreciation and amortization 75,746 53,177 35,971
Amortization of debt discount and transaction costs 19,621 728 0
Amortization of deferred commissions 80,159 63,891 58,732
Expenses related to stock-based awards 120,429 88,892 77,366
Excess tax benefits from employee stock plans (35,991) (51,539) (54,597)
Loss on securities 0 0 1,783
Changes in assets and liabilities:
Accounts receivable, net (102,507) (54,522) (44,798)
Deferred commissions (121,247) (82,336) (63,701)
Prepaid expenses and other current assets 2,001 (3,899) (4,746)
Other assets (9,770) (1,405) (1,292)
Accounts payable 1,246 (1,588) 8,512
Accrued expenses and other current liabilities 132,004 64,498 55,440
Deferred revenue 227,693 110,322 112,852
Net cash provided by operating activities 459,081 270,911 229,557
Investing activities:
Business combinations, net of cash acquired (403,331) (11,999) (27,907)
Land activity and building improvements (277,944) 0 0
Strategic investments (20,105) (4,400) 0
Purchases of marketable securities (1,682,549) (1,317,952) (449,035)
Sales of marketable securities 1,197,492 874,573 154,287
Maturities of marketable securities 214,770 130,663 284,339
Capital expenditures (90,887) (49,501) (61,059)
Net cash used in investing activities (1,062,554) (378,616) (99,375)
Financing activities:
Proceeds from borrowings on convertible debt 0 567,094 0
Proceeds from issuance of warrants 0 59,283 0
Purchase of convertible note hedge 0 (126,500) 0
Purchase of subsidiary stock (171,964) 0 (21,622)
Proceeds from the exercise of stock options 160,402 93,856 43,311
Excess tax benefits from employee stock plans 35,991 51,539 54,597
Principal payments on capital lease obligations (10,355) (8,119) (997)
Net cash provided by financing activities 14,074 637,153 75,289
Effect of exchange rate changes 2,385 (1,976) (732)
Net increase (decrease) in cash and cash equivalents (587,014) 527,472 204,739
Cash and cash equivalents, beginning of period 1,011,306 483,834 279,095
Cash and cash equivalents, end of period $ 424,292 $ 1,011,306 $ 483,834
Supplemental cash flow disclosure:
Cash paid during the period for:
Interest, net $ 1,250 $ 1,069 $ 107
Income taxes, net of tax refunds $ 90 $ 28,479 $ 9,600
Non-cash financing and investing activities
Fixed assets acquired under capital leases $ 13,224 $ 17,000 $ 6,406
See accompanying Notes.
59