Salesforce.com 2010 Annual Report Download - page 49
Download and view the complete annual report
Please find page 49 of the 2010 Salesforce.com annual report below. You can navigate through the pages in the report by either clicking on the pages listed below, or by using the keyword search tool below to find specific information within the annual report.-
 1
1 -
2
-
3
-
4
-
5
-
6
-
7
-
8
-
9
-
10
-
11
-
12
-
13
-
14
-
15
-
16
-
17
-
18
-
19
-
20
-
21
-
22
-
23
-
24
-
25
-
26
-
27
-
28
-
29
-
30
-
31
-
32
-
33
-
34
-
35
-
36
-
37
-
38
-
 39
39 -
 40
40 -
 41
41 -
 42
42 -
 43
43 -
 44
44 -
 45
45 -
 46
46 -
 47
47 -
 48
48 -
 49
49 -
 50
50 -
 51
51 -
 52
52 -
 53
53 -
 54
54 -
 55
55 -
 56
56 -
 57
57 -
 58
58 -
 59
59 -
60
-
61
-
62
-
63
-
64
-
65
-
66
-
67
-
68
-
69
-
70
-
71
-
72
-
73
-
74
-
75
-
76
-
77
-
78
-
79
-
80
-
81
-
82
-
83
-
84
-
85
-
86
-
87
-
88
-
89
-
90
-
91
-
92
-
93
-
94
-
95
-
96
-
97
-
98
-
99
-
100
-
101
-
102
-
103
-
104
-
105
-
106
-
107
-
108
-
109
-
110
-
111
-
112
-
113
-
114
-
115
-
116
-
117
-
118
-
119
-
120
-
121
-
122
-
123
-
124
-
125
-
126
-
127
-
128
-
129
-
130
-
131
-
132
-
133
-
134
-
135
-
136
-
137
-
138
-
139
-
140
-
141
-
142
-
143
-
144
-
145
-
146
-
147
-
148
-
149
-
150
-
151
-
152
-
153
-
154
-
155
-
156
-
157
-
158
-
159
-
160
-
161
-
162
-
163
-
164
-
165
-
166
-
167
-
168
-
169
-
170
-
171
-
172
-
173
-
174
-
175
-
176
-
177
-
178
-
179
-
180
-
181
-
182
-
183
-
184
-
185
-
186
-
187
-
188
-
189
-
190
-
191
-
192
-
193
-
194
-
195
-
196
-
197
-
198
-
199
-
200
-
201
-
202
-
203
-
204
-
205
-
206
-
207
-
208
-
209
-
210
-
211
-
212
-
213
-
214
-
215
-
216
-
217
-
218
-
219
-
220
-
221
-
222
-
223
-
224
-
225
-
226
-
227
-
228
-
229
-
230
-
231
-
232
-
233
-
234
-
235
-
236
-
237
-
238
-
239
-
240
-
241
-
242
-
243
-
244
-
245
-
246
-
247
-
248
-
249
-
250
-
251
-
252
-
253
-
254
-
255
-
256
-
257
-
258
-
259
-
260
-
261
-
262
-
263
-
264
-
265
-
266
-
267
-
268
-
269
-
270
-
271
-
272
-
273
-
274
-
275
-
276
-
277
-
278
-
279
-
280
-
281
-
282
-
283
-
284
-
285
-
286
-
287
-
288
-
289
-
290
-
291
-
292
-
293
-
294
-
295
-
296
-
297
-
298
-
299
-
300
-
301
-
302
-
303
-
304
-
305
-
306
-
307
-
308
-
309
-
310
-
311
-
312
-
313
-
314
-
315
-
316
-
317
-
318
-
319
-
320
-
321
-
322
-
323
-
324
-
325
-
326
 |
 |

Table of Contents
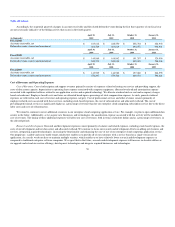
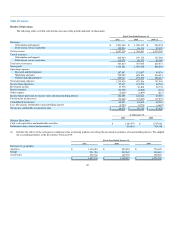
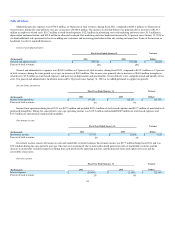
Total revenues were $1.3 billion for fiscal 2010, compared to $1.1 billion for fiscal 2009, an increase of $228.8 million, or 21 percent. Subscription and
support revenues were $1.2 billion, or 93 percent of total revenues, for fiscal 2010, compared to $1.0 billion, or 91 percent of total revenues, during fiscal
2009. Professional services and other revenues were $96.1 million, or 7 percent of total revenues, for fiscal 2010, compared to $92.2 million, or 9 percent of
total revenues, for fiscal 2009. The increase in professional services and other revenues was due primarily to the higher demand for services from an increased
number of paying customers.
Revenues in Europe and Asia Pacific accounted for $381.8 million, or 29 percent of total revenues, for fiscal 2010, compared to $300.3 million, or 28
percent of total revenues, during fiscal 2009, an increase of $81.5 million, or 27 percent. The increase in revenues outside of the Americas was the result of
our efforts to expand internationally. As part of our overall growth, we expect the percentage of our revenue generated in Europe and Asia Pacific to continue
to increase as a percentage of our total revenues world wide.
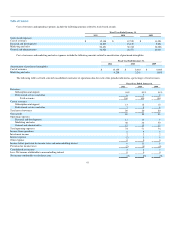
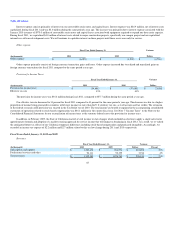
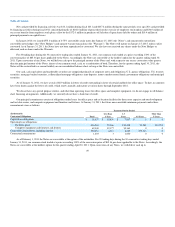
Cost of Revenues.
Fiscal Year Ended January 31, Variance
Dollars
(In thousands) 2010 2009
Subscription and support $ 159,172 $ 127,082 $ 32,090
Professional services and other 98,753 93,389 5,364
Total cost of revenues $ 257,925 $ 220,471 $ 37,454
Percent of total revenues 20% 20%
Cost of revenues was $257.9 million, or 20 percent of total revenues, during fiscal 2010, compared to $220.5 million, or 20 percent of total revenues,
during fiscal 2009, an increase of $37.4 million. The increase in absolute dollars was primarily due to an increase of $8.4 million in employee-related costs, an
increase of $1.5 million in stock-based expenses, an increase of $7.2 million in service delivery costs, primarily due to our investments in increasing data
center capacity, an increase of $9.8 million in depreciation and amortization expenses, an increase of $6.7 million in outside subcontractor and other service
costs and an increase of $1.6 million in allocated overhead. The cost of the professional services headcount resulted in the cost of professional services and
other revenues to be in excess of the related revenue during fiscal 2010 by $2.6 million as compared to $1.2 million during fiscal 2009.
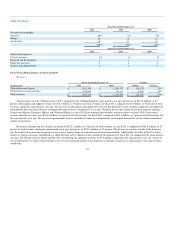
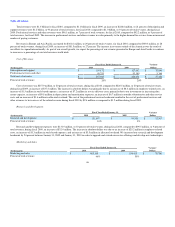
Research and Development.
Fiscal Year Ended January 31, Variance
Dollars
(In thousands) 2010 2009
Research and development $ 131,897 $ 99,530 $ 32,367
Percent of total revenues 10% 9%
Research and development expenses were $131.9 million, or 10 percent of total revenues, during fiscal 2010, compared to $99.5 million, or 9 percent of
total revenues, during fiscal 2009, an increase of $32.4 million. The increase in absolute dollars was due to an increase of $25.2 million in employee-related
costs, an increase of $3.3 million in stock-based expenses, and an increase of $3.5 million in allocated overhead. We increased our research and development
headcount by 24 percent between January 31, 2009 and January 31, 2010 in order to upgrade and extend our service offerings and develop new technologies.
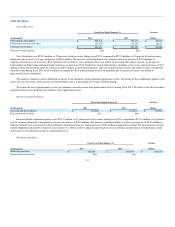
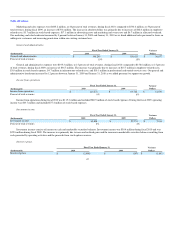
Marketing and Sales.
Fiscal Year Ended January 31, Variance
Dollars
(In thousands) 2010 2009
Marketing and sales $ 605,199 $ 534,413 $ 70,786
Percent of total revenues 46% 50%
46