Salesforce.com 2010 Annual Report Download - page 69
Download and view the complete annual report
Please find page 69 of the 2010 Salesforce.com annual report below. You can navigate through the pages in the report by either clicking on the pages listed below, or by using the keyword search tool below to find specific information within the annual report.-
 1
1 -
2
-
3
-
4
-
5
-
6
-
7
-
8
-
9
-
10
-
11
-
12
-
13
-
14
-
15
-
16
-
17
-
18
-
19
-
20
-
21
-
22
-
23
-
24
-
25
-
26
-
27
-
28
-
29
-
30
-
31
-
32
-
33
-
34
-
35
-
36
-
37
-
38
-
39
-
40
-
41
-
42
-
43
-
44
-
45
-
46
-
47
-
48
-
49
-
50
-
51
-
52
-
53
-
54
-
55
-
56
-
57
-
58
-
 59
59 -
 60
60 -
 61
61 -
 62
62 -
 63
63 -
 64
64 -
 65
65 -
 66
66 -
 67
67 -
 68
68 -
 69
69 -
 70
70 -
 71
71 -
 72
72 -
 73
73 -
 74
74 -
 75
75 -
 76
76 -
 77
77 -
 78
78 -
 79
79 -
80
-
81
-
82
-
83
-
84
-
85
-
86
-
87
-
88
-
89
-
90
-
91
-
92
-
93
-
94
-
95
-
96
-
97
-
98
-
99
-
100
-
101
-
102
-
103
-
104
-
105
-
106
-
107
-
108
-
109
-
110
-
111
-
112
-
113
-
114
-
115
-
116
-
117
-
118
-
119
-
120
-
121
-
122
-
123
-
124
-
125
-
126
-
127
-
128
-
129
-
130
-
131
-
132
-
133
-
134
-
135
-
136
-
137
-
138
-
139
-
140
-
141
-
142
-
143
-
144
-
145
-
146
-
147
-
148
-
149
-
150
-
151
-
152
-
153
-
154
-
155
-
156
-
157
-
158
-
159
-
160
-
161
-
162
-
163
-
164
-
165
-
166
-
167
-
168
-
169
-
170
-
171
-
172
-
173
-
174
-
175
-
176
-
177
-
178
-
179
-
180
-
181
-
182
-
183
-
184
-
185
-
186
-
187
-
188
-
189
-
190
-
191
-
192
-
193
-
194
-
195
-
196
-
197
-
198
-
199
-
200
-
201
-
202
-
203
-
204
-
205
-
206
-
207
-
208
-
209
-
210
-
211
-
212
-
213
-
214
-
215
-
216
-
217
-
218
-
219
-
220
-
221
-
222
-
223
-
224
-
225
-
226
-
227
-
228
-
229
-
230
-
231
-
232
-
233
-
234
-
235
-
236
-
237
-
238
-
239
-
240
-
241
-
242
-
243
-
244
-
245
-
246
-
247
-
248
-
249
-
250
-
251
-
252
-
253
-
254
-
255
-
256
-
257
-
258
-
259
-
260
-
261
-
262
-
263
-
264
-
265
-
266
-
267
-
268
-
269
-
270
-
271
-
272
-
273
-
274
-
275
-
276
-
277
-
278
-
279
-
280
-
281
-
282
-
283
-
284
-
285
-
286
-
287
-
288
-
289
-
290
-
291
-
292
-
293
-
294
-
295
-
296
-
297
-
298
-
299
-
300
-
301
-
302
-
303
-
304
-
305
-
306
-
307
-
308
-
309
-
310
-
311
-
312
-
313
-
314
-
315
-
316
-
317
-
318
-
319
-
320
-
321
-
322
-
323
-
324
-
325
-
326
 |
 |

Table of Contents
Impairment of Long-Lived Assets
The Company evaluates the recoverability of its long-lived assets for possible impairment whenever events or circumstances indicate that the carrying
amount of such assets may not be recoverable. If such review indicates that the carrying amount of long-lived assets is not recoverable, the carrying amount of
such assets is reduced to fair value.
There was no impairment of long-lived assets during fiscal 2011, 2010, and 2009.
The Company evaluates and tests the recoverability of the goodwill for impairment annually in the fourth quarter or more often if and when
circumstances indicate that goodwill may not be recoverable. There was no impairment of goodwill during fiscal 2011, 2010, and 2009.
Capitalized Software Costs
For its website development costs and the development costs related to its enterprise cloud computing services, the company capitalizes costs incurred
during the application development stage. Costs related to preliminary project activities and post implementation activities were expensed as incurred.
Internal-use software is amortized on a straight line basis over its estimated useful life, generally three years. Management evaluates the useful lives of these
assets on an annual basis and tests for impairment whenever events or changes in circumstances occur that could impact the recoverability of these assets.
The Company capitalized $19.6 million, $15.1 million, and $10.2 million of costs during fiscal 2011, 2010, and 2009, respectively. Amortization
expense totaled $13.1 million, $9.9 million, and $6.6 million during fiscal 2011, 2010 and 2009, respectively.
Comprehensive Income (loss)
Comprehensive income (loss) consists of net income and accumulated other comprehensive income (loss), which includes certain changes in equity that
are excluded from net income. Specifically, cumulative foreign currency translation adjustments and unrealized gains and losses on marketable securities, net
of taxes of $5.0 million in fiscal 2011 and $3.9 million in fiscal 2010, are included in accumulated other comprehensive income (loss). Accumulated other
comprehensive income (loss) has been reflected in stockholders' equity.
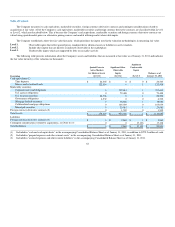
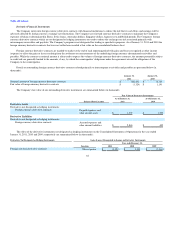
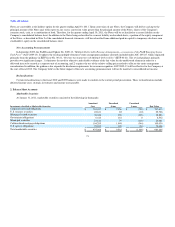
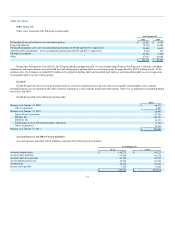
The components of accumulated other comprehensive income (loss) were as follows (in thousands):
As of January 31,
2011 2010
Foreign currency translation and other adjustments $ (1,357) $ (7,066)
Net unrealized gain on marketable securities 8,076 5,636
$ 6,719 $ (1,430)
Net Income Per Share
Basic net income per share attributable to salesforce.com is computed by dividing net income attributable to salesforce.com by the weighted-average
number of common shares outstanding for the fiscal period. Diluted net income per share attributable to salesforce.com is computed giving effect to all
potential weighted average dilutive common stock, including options, restricted stock units, warrants and the convertible senior notes. The dilutive effect of
outstanding awards is reflected in diluted earnings per share by application of the treasury stock method.
66