Salesforce.com 2010 Annual Report Download - page 39
Download and view the complete annual report
Please find page 39 of the 2010 Salesforce.com annual report below. You can navigate through the pages in the report by either clicking on the pages listed below, or by using the keyword search tool below to find specific information within the annual report.-
 1
1 -
2
-
3
-
4
-
5
-
6
-
7
-
8
-
9
-
10
-
11
-
12
-
13
-
14
-
15
-
16
-
17
-
18
-
19
-
20
-
21
-
22
-
23
-
24
-
25
-
26
-
27
-
28
-
 29
29 -
 30
30 -
 31
31 -
 32
32 -
 33
33 -
 34
34 -
 35
35 -
 36
36 -
 37
37 -
 38
38 -
 39
39 -
 40
40 -
 41
41 -
 42
42 -
 43
43 -
 44
44 -
 45
45 -
 46
46 -
 47
47 -
 48
48 -
 49
49 -
50
-
51
-
52
-
53
-
54
-
55
-
56
-
57
-
58
-
59
-
60
-
61
-
62
-
63
-
64
-
65
-
66
-
67
-
68
-
69
-
70
-
71
-
72
-
73
-
74
-
75
-
76
-
77
-
78
-
79
-
80
-
81
-
82
-
83
-
84
-
85
-
86
-
87
-
88
-
89
-
90
-
91
-
92
-
93
-
94
-
95
-
96
-
97
-
98
-
99
-
100
-
101
-
102
-
103
-
104
-
105
-
106
-
107
-
108
-
109
-
110
-
111
-
112
-
113
-
114
-
115
-
116
-
117
-
118
-
119
-
120
-
121
-
122
-
123
-
124
-
125
-
126
-
127
-
128
-
129
-
130
-
131
-
132
-
133
-
134
-
135
-
136
-
137
-
138
-
139
-
140
-
141
-
142
-
143
-
144
-
145
-
146
-
147
-
148
-
149
-
150
-
151
-
152
-
153
-
154
-
155
-
156
-
157
-
158
-
159
-
160
-
161
-
162
-
163
-
164
-
165
-
166
-
167
-
168
-
169
-
170
-
171
-
172
-
173
-
174
-
175
-
176
-
177
-
178
-
179
-
180
-
181
-
182
-
183
-
184
-
185
-
186
-
187
-
188
-
189
-
190
-
191
-
192
-
193
-
194
-
195
-
196
-
197
-
198
-
199
-
200
-
201
-
202
-
203
-
204
-
205
-
206
-
207
-
208
-
209
-
210
-
211
-
212
-
213
-
214
-
215
-
216
-
217
-
218
-
219
-
220
-
221
-
222
-
223
-
224
-
225
-
226
-
227
-
228
-
229
-
230
-
231
-
232
-
233
-
234
-
235
-
236
-
237
-
238
-
239
-
240
-
241
-
242
-
243
-
244
-
245
-
246
-
247
-
248
-
249
-
250
-
251
-
252
-
253
-
254
-
255
-
256
-
257
-
258
-
259
-
260
-
261
-
262
-
263
-
264
-
265
-
266
-
267
-
268
-
269
-
270
-
271
-
272
-
273
-
274
-
275
-
276
-
277
-
278
-
279
-
280
-
281
-
282
-
283
-
284
-
285
-
286
-
287
-
288
-
289
-
290
-
291
-
292
-
293
-
294
-
295
-
296
-
297
-
298
-
299
-
300
-
301
-
302
-
303
-
304
-
305
-
306
-
307
-
308
-
309
-
310
-
311
-
312
-
313
-
314
-
315
-
316
-
317
-
318
-
319
-
320
-
321
-
322
-
323
-
324
-
325
-
326
 |
 |

Table of Contents
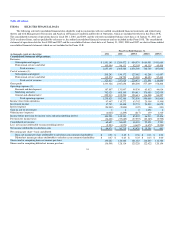
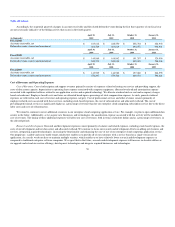
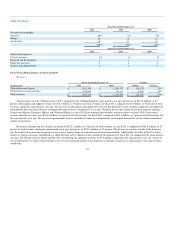
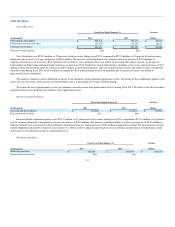
Accordingly, the sequential quarterly changes in accounts receivable and the related deferred revenue during the first three quarters of our fiscal year
are not necessarily indicative of the billing activity that occurs in the fourth quarter.
(in thousands)
April 30,
2010
July 31,
2010
October 31,
2010
January 31,
2011
Fiscal 2011
Accounts receivable, net $ 183,612 $ 228,550 $ 258,764 $ 426,943
Deferred revenue, current and noncurrent 664,529 683,019 694,557 934,941
April 30,
2009
July 31,
2009
October 31,
2009
January 31,
2010
Fiscal 2010
Accounts receivable, net $ 145,869 $ 168,842 $ 191,297 $ 320,956
Deferred revenue, current and noncurrent 549,373 549,010 545,435 704,348
April 30,
2008
July 31,
2008
October 31,
2008
January 31,
2009
Fiscal 2009
Accounts receivable, net $ 143,909 $ 146,982 $ 157,680 $ 266,555
Deferred revenue, current and noncurrent 470,297 479,546 469,534 594,026
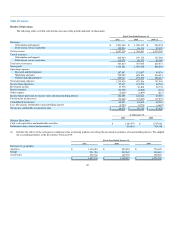
Cost of Revenues and Operating Expenses
Cost of Revenues. Cost of subscription and support revenues primarily consists of expenses related to hosting our service and providing support, the
costs of data center capacity, depreciation or operating lease expense associated with computer equipment, allocated overhead and amortization expense
associated with capitalized software related to our application service and acquired technology. We allocate overhead such as rent and occupancy charges
based on headcount. Employee benefit costs and taxes are allocated based upon a percentage of total compensation expense. As such, general overhead
expenses are reflected in each cost of revenue and operating expense category. Cost of professional services and other revenues consists primarily of
employee-related costs associated with these services, including stock-based expenses, the cost of subcontractors and allocated overhead. The cost of
providing professional services is significantly higher as a percentage of revenue than for our enterprise cloud computing subscription service due to the direct
labor costs and costs of subcontractors.
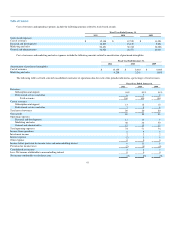
We intend to continue to invest additional resources in our enterprise cloud computing application service. For example, we plan to open additional data
centers in the future. Additionally, as we acquire new businesses and technologies, the amortization expense associated with this activity will be included in
cost of revenues. The timing of these additional expenses will affect our cost of revenues, both in terms of absolute dollars and as a percentage of revenues, in
the affected periods.
Research and Development. Research and development expenses consist primarily of salaries and related expenses, including stock-based expenses, the
costs of our development and test data center and allocated overhead. We continue to focus our research and development efforts on adding new features and
services, integrating acquired technologies, increasing the functionality and enhancing the ease of use of our enterprise cloud computing application service.
Our proprietary, scalable and secure multi-tenant architecture enables us to provide all of our customers with a service based on a single version of our
application. As a result, we do not have to maintain multiple versions, which enables us to have relatively lower research and development expenses as
compared to traditional enterprise software companies. We expect that in the future, research and development expenses will increase in absolute dollars as
we upgrade and extend our service offerings, develop new technologies and integrate acquired businesses and technologies.
36