Royal Caribbean Cruise Lines 2002 Annual Report Download - page 32
Download and view the complete annual report
Please find page 32 of the 2002 Royal Caribbean Cruise Lines annual report below. You can navigate through the pages in the report by either clicking on the pages listed below, or by using the keyword search tool below to find specific information within the annual report.-
 1
1 -
2
-
3
-
4
-
5
-
6
-
7
-
8
-
9
-
10
-
11
-
12
-
13
-
14
-
15
-
16
-
17
-
18
-
19
-
20
-
21
-
 22
22 -
 23
23 -
 24
24 -
 25
25 -
 26
26 -
 27
27 -
 28
28 -
 29
29 -
 30
30 -
 31
31 -
 32
32 -
 33
33 -
 34
34 -
 35
35 -
 36
36 -
 37
37 -
 38
38 -
 39
39 -
 40
40 -
 41
41 -
 42
42 -
43
-
44
-
45
 |
 |

30
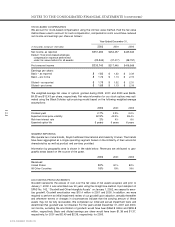
ROYAL CARIBBEAN CRUISES LTD.
NOTES TO THE CONSOLIDATED FINANCIAL STATEMENTS (continued)
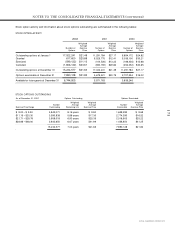
STOCK-BASED COMPENSATION
We account for stock-based compensation using the intrinsic value method. Had the fair value
method been used to account for such compensation, compensation costs would have reduced
net income and earnings per share as follows:
Year Ended December 31,
(in thousands, except per share data)
2002 2001 2000
Net income, as reported $351,284 $254,457 $445,363
Deduct: Total stock-based employee
compensation expense determined
under fair value method for all awards (20,544) (37,017) (28,797)
Pro forma net income $330,740 $217,440 $416,566
Earnings per share:
Basic – as reported $ 1.82 $ 1.32 $ 2.34
Basic – pro forma $ 1.72 $ 1.13 $ 2.19
Diluted – as reported $ 1.79 $ 1.32 $ 2.31
Diluted – pro forma $ 1.69 $ 1.13 $ 2.18
The weighted-average fair value of options granted during 2002, 2001 and 2000 was $6.84,
$4.35 and $12.43 per share, respectively. Fair value information for our stock options was esti-
mated using the Black-Scholes option-pricing model based on the following weighted-average
assumptions:
2002 2001 2000
Dividend yield 2.7% 2.5% 2.0%
Expected stock price volatility 42.9% 43.3% 38.4%
Risk-free interest rate 3% 4% 6%
Expected option life 5 years 5 years 6 years
SEGMENT REPORTING
We operate two cruise brands, Royal Caribbean International and Celebrity Cruises. The brands
have been aggregated as a single operating segment based on the similarity of their economic
characteristics as well as product and services provided.
Information by geographic area is shown in the table below. Revenues are attributed to geo-
graphic areas based on the source of the guest.
2002 2001 2000
Revenues:
United States 82% 81% 82%
All Other Countries 18% 19% 18%
ACCOUNTING PRONOUNCEMENTS
Goodwill represents the excess of cost over the fair value of net assets acquired, and prior to
January 1, 2002, it was amortized over 40 years using the straight-line method. Upon adoption of
SFAS No. 142, “ Goodwill and Other Intangible Assets” on January 1, 2002, we ceased to amor-
tize goodwill. Goodwill amortization was $10.4 million in 2001 and 2000. In addition, we were
required to perform an initial impairment review of our goodwill upon adoption, annually thereafter
and whenever events or changes in circumstances indicate that the carrying amount of these
assets may not be fully recoverable. We completed our initial and annual impairment tests and
determined that goodwill was not impaired. For the years ended December 31, 2001 and 2000,
net income, excluding the amortization of goodwill, would have been $264.9 million and $455.8
million, respectively. Basic and diluted earnings per share would have been $1.38 and $1.37,
respectively, for 2001 and $2.40 and $2.36, respectively, for 2000.