Royal Caribbean Cruise Lines 2002 Annual Report Download - page 3
Download and view the complete annual report
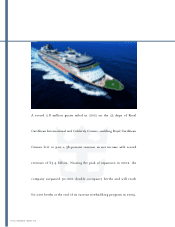
Please find page 3 of the 2002 Royal Caribbean Cruise Lines annual report below. You can navigate through the pages in the report by either clicking on the pages listed below, or by using the keyword search tool below to find specific information within the annual report.-
 1
1 -
 2
2 -
 3
3 -
 4
4 -
 5
5 -
 6
6 -
 7
7 -
 8
8 -
 9
9 -
 10
10 -
 11
11 -
 12
12 -
 13
13 -
 14
14 -
15
-
16
-
17
-
18
-
19
-
20
-
21
-
22
-
23
-
24
-
25
-
26
-
27
-
28
-
29
-
30
-
31
-
32
-
33
-
34
-
35
-
36
-
37
-
38
-
39
-
40
-
41
-
42
-
43
-
44
-
45
 |
 |

ROYAL CARIBBEAN CRUISES LTD.
1
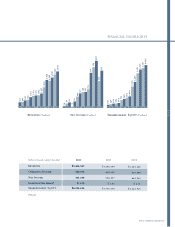
FINANCIAL HIGHLIGHTS
(dollars in thousands, except per share data) 2002 2001 2000
Revenues
Operating Income
Net Income
Earnings Per Share*
Shareholders’ Equity
$$33,,443344,,334477
555500,,997755
335511,,228844
$$ 11..7799
$$44,,003344,,669944
$3,145,250
455,605
254,457
$ 1.32
$3,756,584
$2,865,846
569,540
445,363
$ 2.31
$3,615,915
Revenues ($ millions) Net Income ($ millions) Shareholders’ Equity ($ millions)
88 89 90 91 92 93 94 95 96 97 98 99 00 01 02 88 89 90 91 92 93 94 95 96 97 98 99 00 01 02 88 89 90 91 92 93 94 95 96 97 98 99 00 01 02
523
567
698
760
1,013
1,113
1,171
1,184
1,357
1,939
2,636
2,546
2,866
3,145
3,434
14
42
52
4
61
107
137
149
151
175
331
384
445
254
351
(*diluted)
295
348
400
404
464
733
846
965
1,085
2,019
2,455
3,261
3,616
3,757
4,035