Royal Caribbean Cruise Lines 2002 Annual Report Download - page 28
Download and view the complete annual report
Please find page 28 of the 2002 Royal Caribbean Cruise Lines annual report below. You can navigate through the pages in the report by either clicking on the pages listed below, or by using the keyword search tool below to find specific information within the annual report.-
 1
1 -
2
-
3
-
4
-
5
-
6
-
7
-
8
-
9
-
10
-
11
-
12
-
13
-
14
-
15
-
16
-
17
-
 18
18 -
 19
19 -
 20
20 -
 21
21 -
 22
22 -
 23
23 -
 24
24 -
 25
25 -
 26
26 -
 27
27 -
 28
28 -
 29
29 -
 30
30 -
 31
31 -
 32
32 -
 33
33 -
 34
34 -
 35
35 -
 36
36 -
 37
37 -
 38
38 -
39
-
40
-
41
-
42
-
43
-
44
-
45
 |
 |

26
ROYAL CARIBBEAN CRUISES LTD.
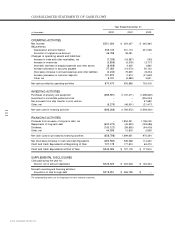
CONSOLIDATED STATEMENTS OF CASH FLOWS
Year Ended December 31,
(in thousands)
2002 2001 2000
OPERATING ACTIVITIES
Net income $351,284 $ 254,457 $ 445,363
Adjustments:
Depreciation and amortization 339,100 301,174 231,048
Accretion of original issue discount 46,796 36,061 –
Changes in operating assets and liabilities:
Increase in trade and other receivables, net (7,339) (18,587) (150)
Increase in inventories (3,806) (3,378) (3,717)
(Increase) decrease in prepaid expenses and other assets (8,469) 3,305 1,865
Increase (decrease) in accounts payable 27,083 (14,073) 55,102
(Decrease) increase in accrued expenses and other liabilities (2,240) 75,645 (8,204)
Increase (decrease) in customer deposits 121,870 2,674 (21,622)
Other, net 6,191 (3,589) 3,631
Net cash provided by operating activities 870,470 633,689 703,316
INVESTING ACTIVITIES
Purchases of property and equipment (689,991) (1,737,471) (1,285,649)
Investment in convertible preferred stock –– (305,044)
Net proceeds from ship transfer to joint venture –– 47,680
Other, net (6,275) (46,501) (21,417)
Net cash used in investing activities (696,266) (1,783,972) (1,564,430)
FINANCING ACTIVITIES
Proceeds from issuance of long-term debt, net –1,834,341 1,195,000
Repayments of long-term debt (603,270) (45,553) (128,086)
Dividends (100,127) (99,955) (94,418)
Other, net 44,599 10,818 2,958
Net cash (used in) provided by financing activities (658,798) 1,699,651 975,454
Net (Decrease) Increase in Cash and Cash Equivalents (484,594) 549,368 114,340
Cash and Cash Equivalents at Beginning of Year 727,178 177,810 63,470
Cash and Cash Equivalents at End of Year $242,584 $ 727,178 $ 177,810
SUPPLEMENTAL DISCLOSURES
Cash paid during the year for:
Interest, net of amount capitalized $236,523 $ 203,038 $ 146,434
Noncash investing and financing activities:
Acquisition of ship through debt $319,951 $ 326,738 $ –
The accompanying notes are an integral part of these financial statements.