Royal Caribbean Cruise Lines 2002 Annual Report Download - page 20
Download and view the complete annual report
Please find page 20 of the 2002 Royal Caribbean Cruise Lines annual report below. You can navigate through the pages in the report by either clicking on the pages listed below, or by using the keyword search tool below to find specific information within the annual report.-
 1
1 -
2
-
3
-
4
-
5
-
6
-
7
-
8
-
9
-
 10
10 -
 11
11 -
 12
12 -
 13
13 -
 14
14 -
 15
15 -
 16
16 -
 17
17 -
 18
18 -
 19
19 -
 20
20 -
 21
21 -
 22
22 -
 23
23 -
 24
24 -
 25
25 -
 26
26 -
 27
27 -
 28
28 -
 29
29 -
 30
30 -
31
-
32
-
33
-
34
-
35
-
36
-
37
-
38
-
39
-
40
-
41
-
42
-
43
-
44
-
45
 |
 |

18
ROYAL CARIBBEAN CRUISES LTD.
MANAGEMENT'S DISCUSSION AND ANALYSIS OF FINANCIAL
CONDITION AND RESULTS OF OPERATIONS (continued)
Year Ended December 31, 2002 Compared to Year Ended December 31, 2001
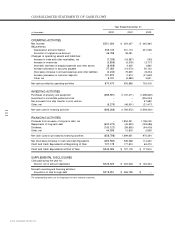
REVENUES
Revenues increased 9.2% to $3.4 billion from $3.1 billion in 2001. The increase in revenues
was primarily due to a 15.0% increase in capacity, partially offset by a 5.1% decline in gross
revenue per available passenger cruise day. The increase in capacity was associated with the
additions of
Infinity
,
Radiance of the Seas
,
Summit
and
Adventure of the Seas
during 2001,
and
Constellation
,
Brilliance of the Seas
and
Navigator of the Seas
in 2002, partially offset by
the transfer of
Viking Serenade
to Island Cruises, our joint venture with First Choice Holidays
PLC. The decline in gross revenue per available passenger cruise day was primarily associat-
ed with a lower percentage of guests who chose to book their air passage through us, lower
cruise ticket prices following the events of September 11, 2001, a general softness in the
United States economy and an increase in industry capacity. Net revenue per available pas-
senger cruise day (“ net yields” ) for 2002 declined 0.7% from 2001. Net revenue represents
gross revenues less costs of air transportation, travel agent commissions and other direct
costs of sales. Occupancy for 2002 was 104.5% compared to 101.8% in 2001.
Each year the cruise industry generally experiences a period of increased bookings, referred to as
the “ wave period,” that begins in early January and typically extends through February. In recent
years, there has been a trend towards bookings closer-in to the sail dates. On January 30, 2003,
we noted that this trend has reduced the importance of the wave period as an indicator of full year
booking patterns while making it even more relevant for first quarter bookings. We also noted that
bookings for the 2003 wave period were slower than we had anticipated, especially for sailings
earlier in the year. We believe this can be attributed to uncertainty about the conflict in Iraq coupled
with a weaker economy and the impact of last December’s publicity concerning stomach flu.
While wave period bookings were lower than 2002, we had very strong bookings for 2003 sail-
ings in late 2002 and we did not have to replace bookings as we did in late 2001 and early 2002
to make up for the bookings lost in the aftermath of September 11, 2001. As a result, we expect-
ed to achieve an increase in net yields for the first quarter of 2003 in the range of 2% to 4%.
Since then, bookings have become even softer and the war in Iraq makes it even more difficult
to make predictions. Nevertheless, we still expect net yields for the first quarter to increase in
the range of 2% to 4%. We also expect that net yields in the second quarter will be below last
year’s level.
EXPENSES
Operating expenses increased 9.2% to $2.1 billion in 2002 compared to $1.9 billion in 2001.
Included in operating expenses in 2002 is a charge of $20.0 million recorded in connection with
a litigation settlement. (See Note 12 – Commitments and Contingencies.) Operating costs per
available passenger cruise day in 2002 declined 5.0% from 2001. The decline on a per available
passenger cruise day basis was associated with fewer guests purchasing air passage through
us and lower commissions resulting from reduced cruise ticket prices.
Marketing, selling and administrative expenses decreased 5.1% to $431.1 million in 2002 com-
pared to $454.1 million in 2001. Marketing, selling and administrative expenses as a percentage of
revenues were 12.6% and 14.4% in 2002 and 2001, respectively. Included in 2001 were charges
associated with business decisions taken subsequent to the events of September 11, 2001 involv-
ing itinerary changes, office closures and severance costs related to a reduction in force. On a per
available passenger cruise day basis, marketing, selling and administrative expenses in 2002
decreased 17.5% from 2001 primarily due to economies of scale and cost reduction initiatives.
Operating and marketing, selling and administrative expenses, on a per available passenger
cruise day basis, are expected to increase 6% to 8% in 2003 attributable in part to increases
in fuel costs, changes in our concession arrangement for the Celebrity brand food service,
the full year impact of the operating lease for
Brilliance of the Seas,
and higher insurance
and security costs.
Depreciation and amortization increased 12.6% to $339.1 million in 2002 from $301.2 million in
2001. The increase was primarily due to incremental depreciation associated with the addition
of new ships, partially offset by the elimination of $10.4 million of goodwill amortization in 2002.
(See Note 2 – Summary of Significant Accounting Policies.)